 | Tombros, S., St. Seymour, K., Williams-Jones, A. E., Spry, P. G. (2007) The Genesis of Epithermal Au-Ag-Te Mineralization, Panormos Bay, Tinos Island, Cyclades, Greece. Economic Geology, 102 (7) 1269-1294 doi:10.2113/gsecongeo.102.7.1269 | Journal (article/letter/editorial) | | Native Au, native Ag, native Cu, native As, stromeyerite, pyrargyrite FIG. 6. Backscattered electron...= pyrargyrite from stage VIII (band D), 20 = stromeyerite from stage VIII (band D) 1 Fe + Au = 1 11 Cu...native silver, native copper, native arsenic, stromeyerite (AgCuS), and pyrargyrite (Ag3SbS3). Native gold... 6d), as intergrowths with minute specks of stromeyerite and pyrargyrite, and as pseudohexagonal grains...petzite. Native copper is intergrown with fibrous stromeyerite, pyrargyrite, and native arsenic. Stage IX minerals | 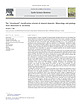 | | Journal (article/letter/editorial) | | Stilpnomelane Stokesite Stolzite Strelkinite Stromeyerite Strontianite Strüverite Suanite Sugilite Sulfur...hanging wall. During a subsequent mining period, the mine was re-opened to recover sideritic parts of the...you look for a mine look near a mine”. This includes the imperative “if you look for a mine look for smelting...also for the chrome diopside found at Outukumpu mine, a mineral that is first and foremost recognized...According to the Raw Materials Group (Sweden), the world mine production in 2005 stood at 19.3 m t metal content | | | Journal (article/letter/editorial) | | Stilpnomelane Stokesite Stolzite Strelkinite Stromeyerite Strontianite Strüverite Suanite Sugilite Sulfur...hanging wall. During a subsequent mining period, the mine was re-opened to recover sideritic parts of the...you look for a mine look near a mine”. This includes the imperative “if you look for a mine look for smelting...also for the chrome diopside found at Outukumpu mine, a mineral that is first and foremost recognized...According to the Raw Materials Group (Sweden), the world mine production in 2005 stood at 19.3 m t metal content |  | | Report (issue) | | .B3 Graph showing dates associated with all the mine sites on the U.S. Environmental Protection Agency’s...production, U.S. apparent consumption, and U.S. mine production of antimony from 1900 to 2012............................F2 Graph showing world cobalt mine and refinery production and apparent consumption.....................F2 Graph showing world cobalt mine production from 1950 to 2011......................F4. Pie chart showing percentage of world cobalt mine production in 2011, by country................. |
|


