Characterization Studies of Ocean Jasper
Last Updated: 19th Feb 2020By Susanne Lomatch-OceanJasper.org
Characterization Studies of Ocean Jasper
Author: Susanne Lomatch*
In this article I present the first known compositional (SEM/EDS) and crystallographic (XRD) characterization studies for 7 specimens of old stock Ocean Jasper. I provide an analysis of the results and I identify a series of next-step characterization tests.
Ocean Jasper is a rare orbicular rock uniquely from Madagascar, classified as a “spherulitic chalcedony”. The rarer high-grade varieties are “old stock”, mined between 2001-2006, mines depleted and no publicly known similar quality veins found since. Feature descriptions, grade classifications, large-format specimen photos, and an extensive discussion of geological information and possible formation are discussed in [1].
Compositional tests reported in this article were done by qualitative energy dispersive x-ray spectroscopy (EDS) via scanning electron microscopy (SEM) using a Cambridge S100 SEM, a XR-100-CR pin diode detector and DTSA software, 25 Kev accelerating voltage [2]. Crystallography tests reported were done by powder x-ray diffraction (XRD) using standard copper Kα radiation diffractometry [3].
SPECIMEN #1
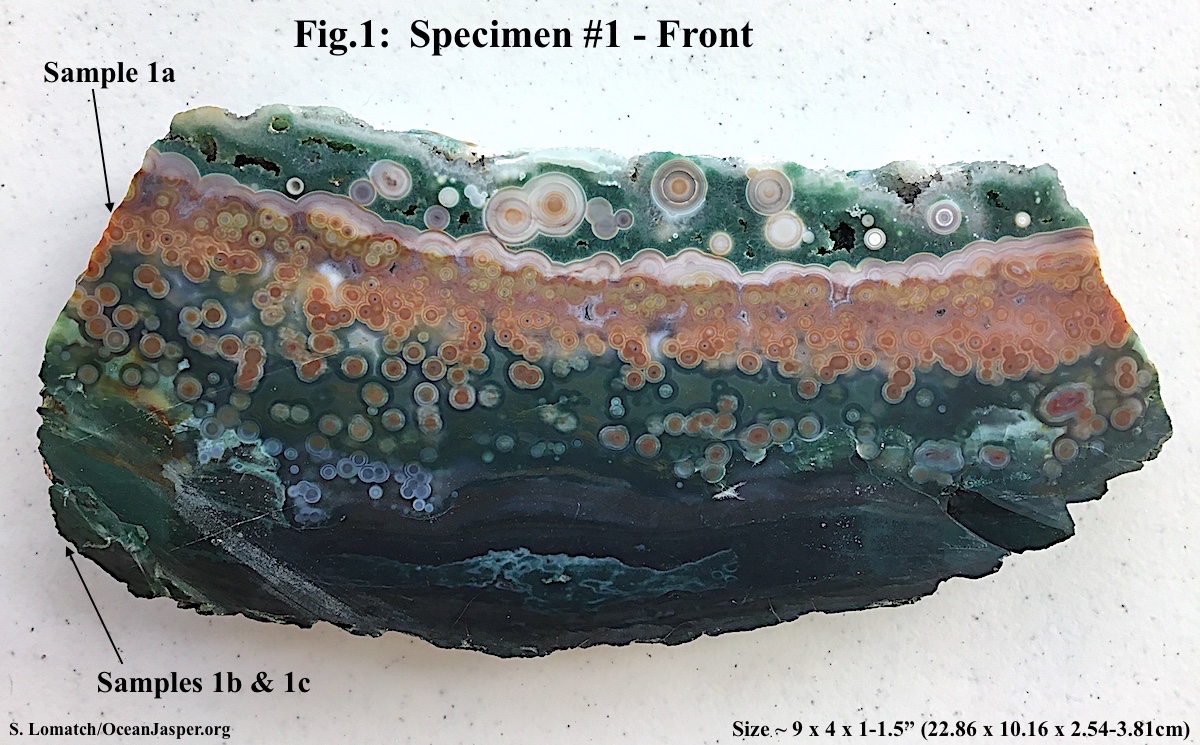
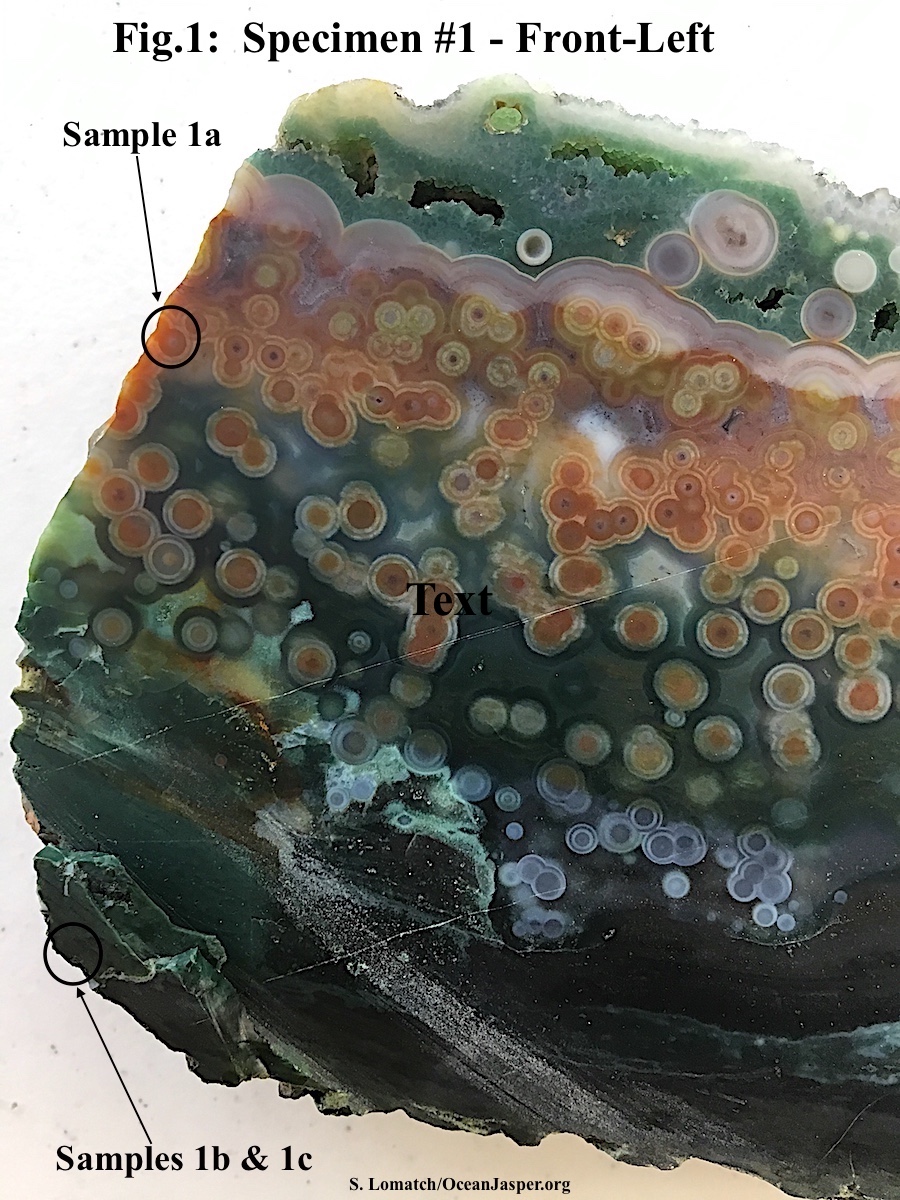
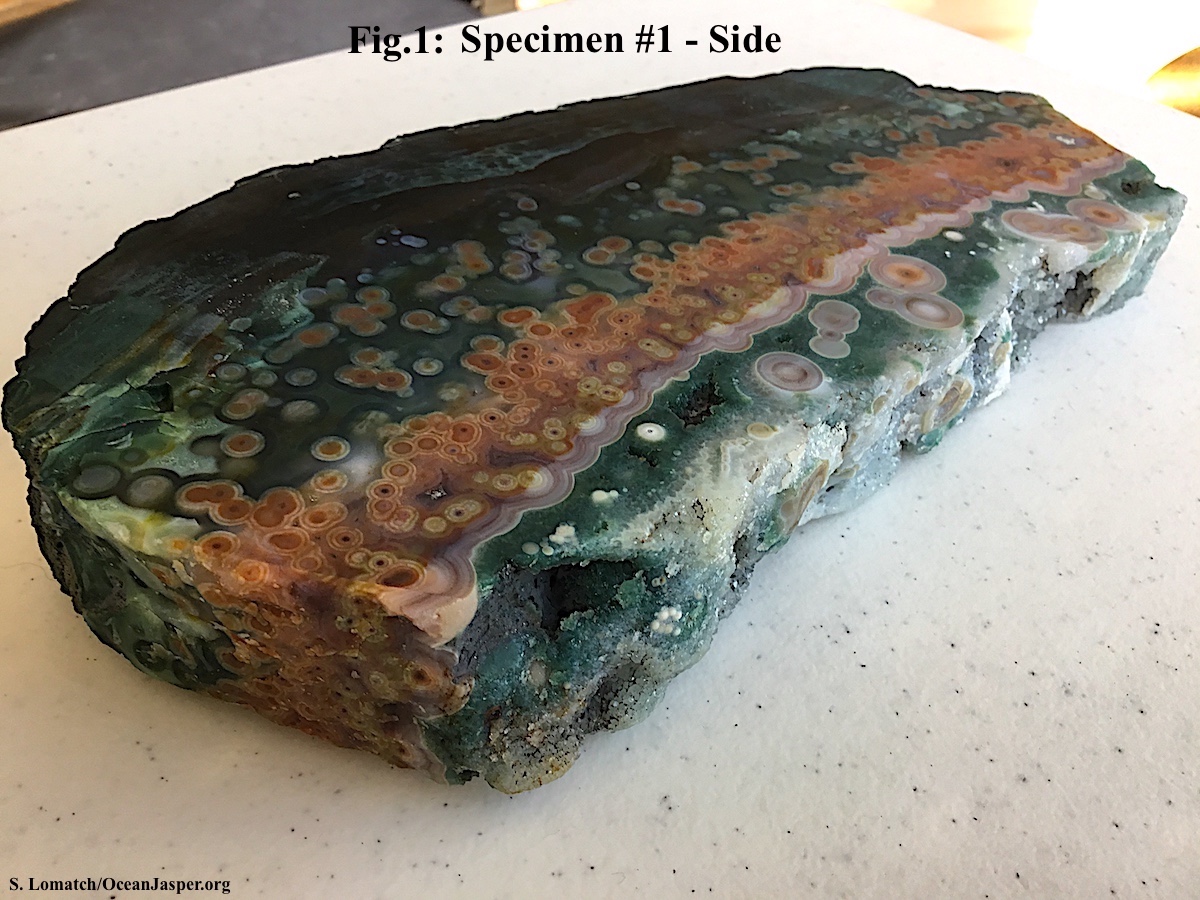
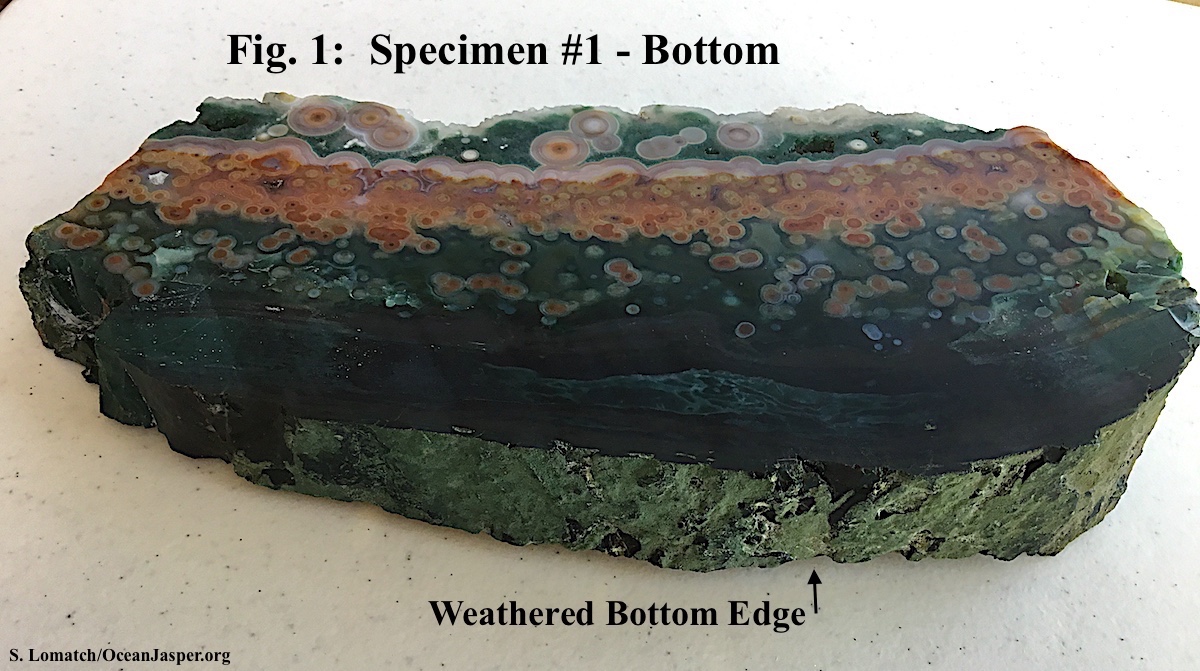
The first specimen is a thick slabbed chunk of ultra-rare old stock Ocean Jasper from off-shore, underground Marovato mines (estimated mining period 2001-2003) with large “bullseye” and compound semi-translucent spherulites in a mixed color semi-translucent chalcedony matrix. The specimen has an outer “rind” of weathered material along the bottom edge and crystalline quartz druzy along the top edge. Three samples were tested from the areas marked in the specimen photos (Fig.1). All three samples were tested by both EDS (Fig.2) and XRD (Fig.3).
Fig.1: Specimen #1 - Front
Fig.1: Specimen #1 - Front-Left
Fig.1: Specimen #1 - Side
Fig.1: Specimen #1 - Bottom
(Note: Right click on Figure links to open figures in new window)
Sample #1a
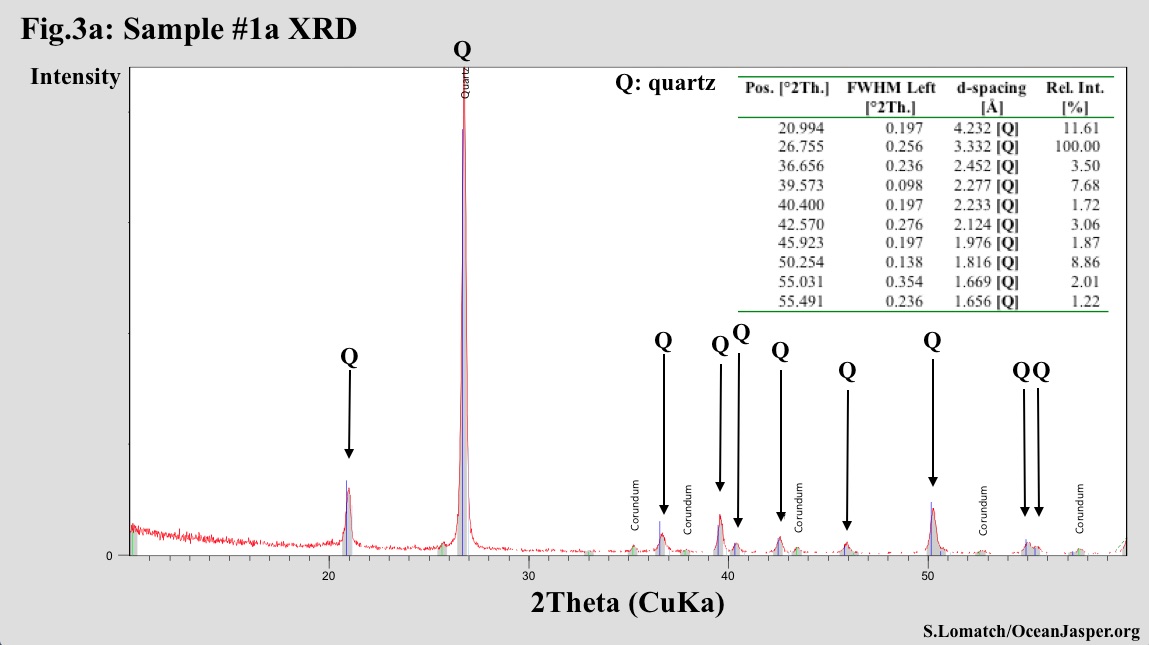
The results show that the orbicular “bullseye” spherulite sample (Sample #1a) is silica quartz (SiO2), no other appreciable elements or minerals present (Figs.2a&3a) other than a trace amount of iron (Fe) that contributes to the color. Since the XRD for chalcedony is almost identical to that of SiO2 quartz [4-9], the XRD characterization (Fig.3a) indicates chalcedony, given that past optical microscopy of spherulites in this material [1,10,11] show fibrous microcrystalline SiO2 (chalcedony) growth of spherulites, though I submit that further imaging characterization should be done on these specimen samples via high-resolution SEM and transmission electron microscopy (TEM), to verify detailed growth characteristics of the spherulites vs. the surrounding matrix. The sharp peaks in the XRD (Fig.3a) with minimal background but slightly broadened (FWHM) peaks over ideal alpha-quartz indicate an ordered microcrystalline chalcedony [4]. The smaller relative intensities of the <1010> secondary peak (4.23Å) and <1122> tertiary peak (1.82Å) compared to ideal alpha-quartz are such an indication. Fig. 3a does not show characteristic SiO2 polymorph moganite peak reflections seen in some samples of chalcedony – these are weak reflections at d-spacings 4.46Å (20.0°), 3.09Å (28.6°) and 2.91Å (31.0°) [4]. It is known that moganite has a structure that can be described as an alternate stacking of left- and right-handed quartz, and can be found intergrown with chalcedony at the twin boundaries; this phase is observed in some samples of chalcedony that under high resolution imaging show length-slow fibrous growth. These additional weak reflections indicating intergrown moganite were not observed in any of the XRDs of samples in this characterization study, including Sample #1a. Only a subset of natural chalcedony samples shows intergrown moganite characteristics [8,9]. I should note that this sample required powder grinding with corundum (Mohs 9+), and that this type of compound spherulite is the hardest of the surrounding material. This was also observed for a similar compound spherulite in another specimen (Specimen #2, Sample #2a).
Fig.2a: Sample #1a – EDS
Fig.3a: Sample #1a – XRD
Sample #1b & 1c
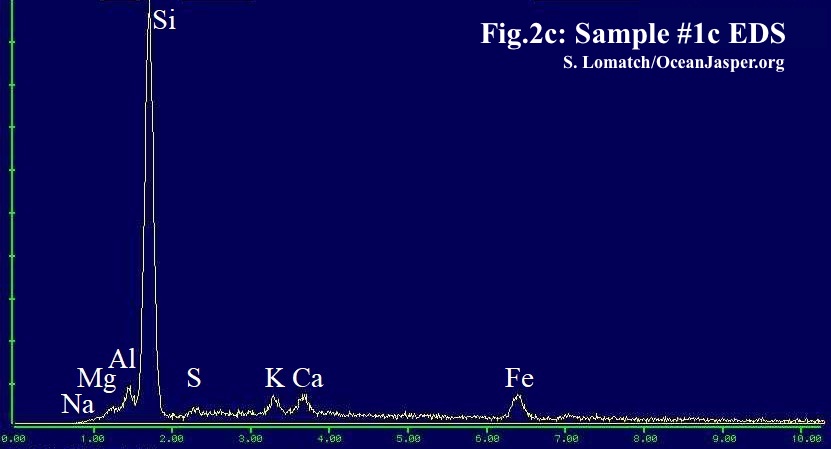
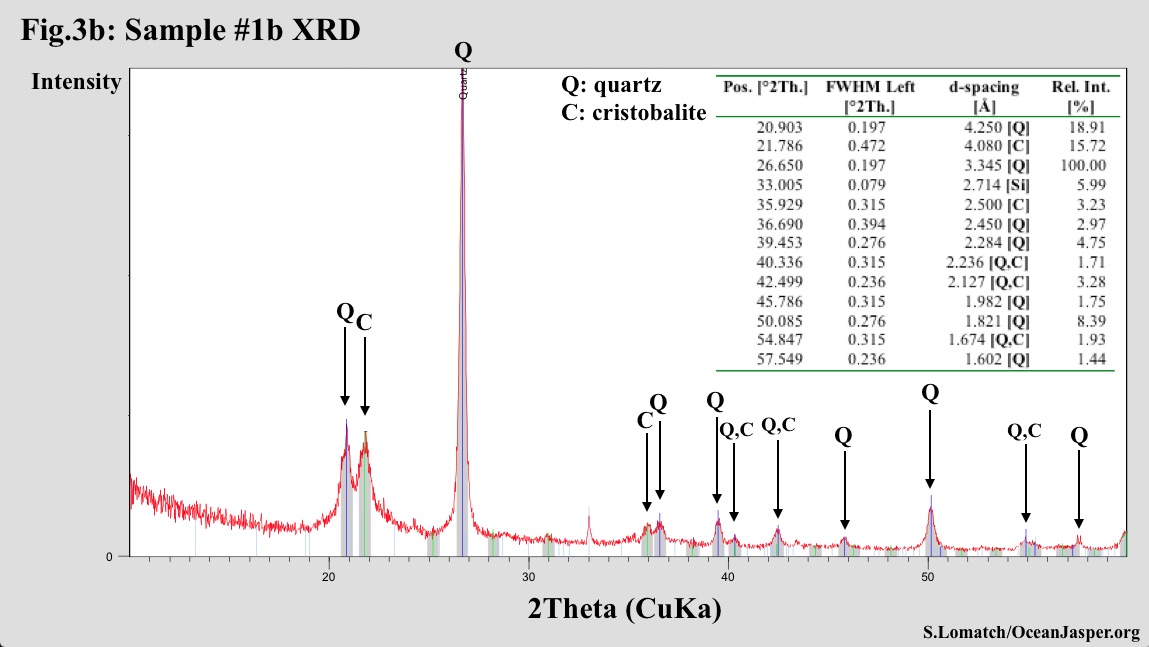
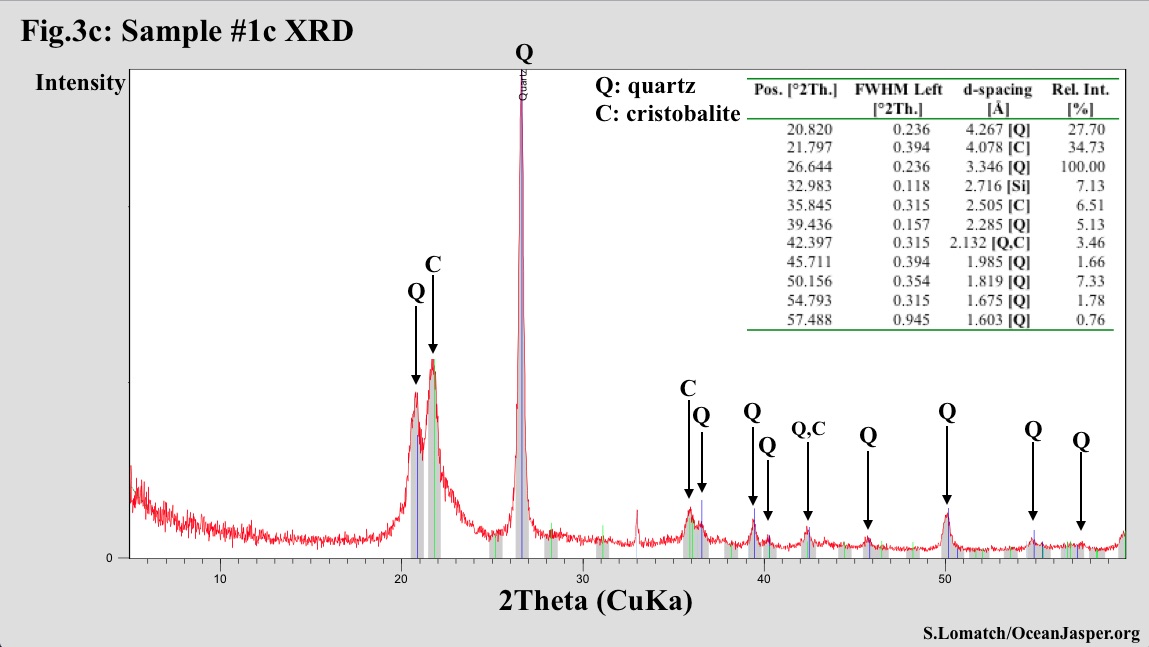
Samples #1b and #1c show an EDS (Figs.2b &2c) indicating silica (SiO2) with trace amounts of potassium/calcium (K/Ca), more so in the edge/weathered Sample #1c, which shows additional trace amounts of sodium/aluminum (Na/Al), magnesium (Mg), and sulfur (S). The trace amount of iron (Fe) in both samples likely accounts for the green color. The EDS detector efficiency
peaks at Ca, thus, all Ca peaks are exaggerated [2]. The XRD results indicate that Sample #1b & 1c are a composite of SiO2 quartz (chalcedony) and alpha-(low)-cristobalite, an estimated 92/8% admixture in #1b and 82/18% admixture in #1c. The first question one will ask is what is the source of the cristobalite. The main peak intensity for natural alpha-cristobalite is 4.04Å, FWHM ~0.09°2Theta; these samples show a main peak at ~4.08Å, FWHM ~0.47° and ~0.39° respectively, and a broadened background, all of which might indicate Opal-C or Opal-CT [12], not crystalline alpha-cristobalite. It is known that the XRD characteristics of disordered alpha-cristobalite can mimic those of Opal-C and a more ordered Opal-CT [12,13]. My guess is that it is not Opal-C or Opal-CT, but disordered low-cristobalite that can occur metastably, and also possibly intergrown with the fibrous chalcedony inherent in this material. Evidence supporting this conjecture was found in a literature search of occurrences of natural alpha-cristobalite in a high-silica rock matrix with such broadened peak-shifted XRD characteristics, which appears in volcanogenic cristobalite [14,15] and cristobalite found in clast-rich melt rock [16]. The conditions attributed to these occurrences of alpha-cristobalite are consistently from a high-silica precursor rapidly cooled from high temperatures. This conjecture can only be affirmed by doing additional studies, namely high-resolution SEM or TEM imaging studies, infrared spectroscopy and a few other specific tests. These are among the “next-step” tests that I recommend for similar samples from this specimen. A microcrystalline quartz-cristobalite admixture is the first known observation in Ocean Jasper. I include an extended discussion of this observation and speculations in the discussion and analysis section below.
Readers should note that trace amounts of Na/Al/K detected in EDS spectra of Samples #1b and #1c can be attributed to the propensity of alpha-cristobalite (and of Opal-C) to incorporate impurities via substitutions of Na, Al and K ions for Si [4,14].
Fig.2b: Sample #1b – EDS
Fig.2c: Sample #1c – EDS
Fig.3b: Sample #1b – XRD
Fig.3c: Sample #1c – XRD
SPECIMEN #2
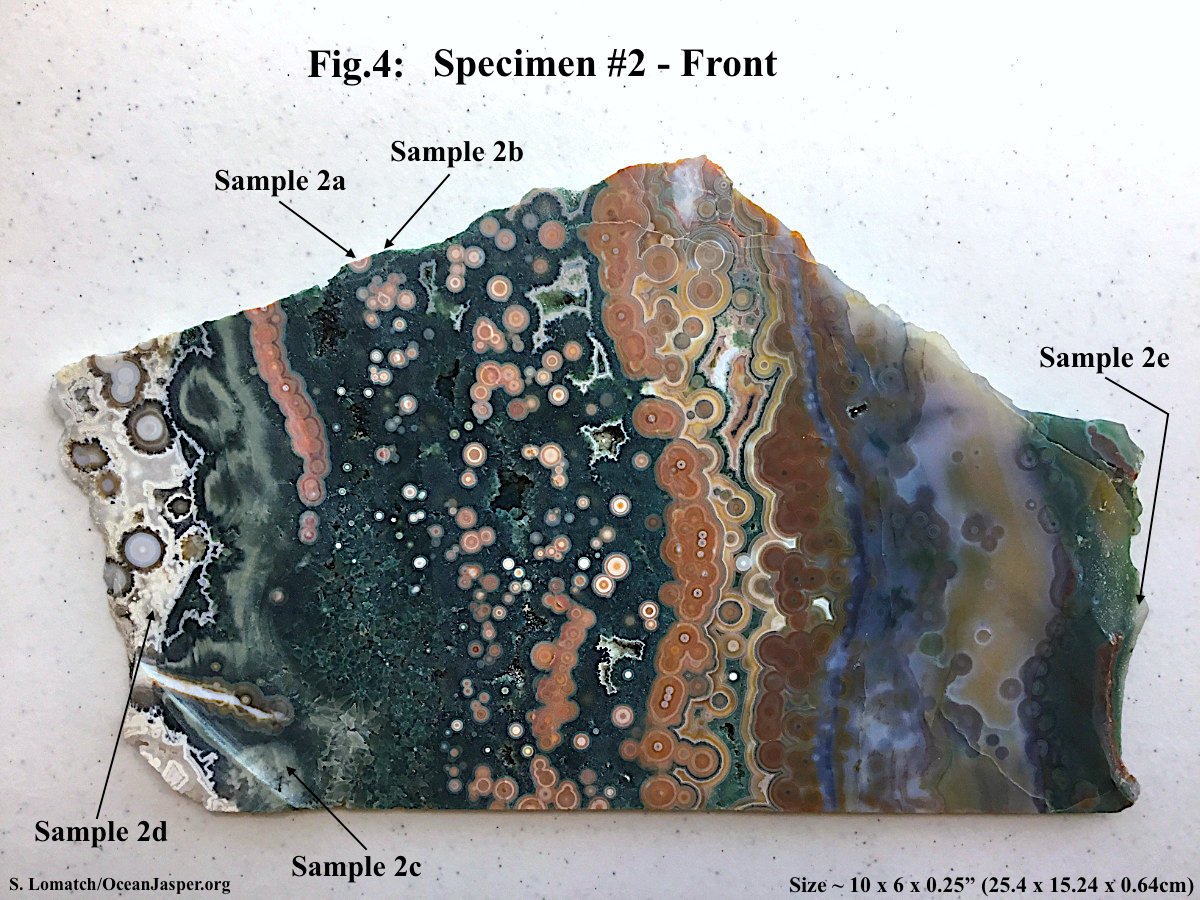
The second specimen is a slab of ultra-rare “hyper-heterogeneous” type old stock Ocean Jasper from off-shore, underground Marovato mines (estimated mining period 2001-2003) that shows several transitions of spherulite and matrix features inherent in the highest grades of old stock material. Five samples were tested from the areas marked in the specimen photo (Fig.4). Three samples (Samples #2a, 2b, 2d) were tested by both EDS (Figs.5a,b,d) and XRD (Figs.6a,b,d); one sample (Sample #2c) by EDS only (Fig.5c), and one sample (Sample #2e) by XRD only (Fig.6e).
Fig.4: Specimen #2 - Front
(Note: Right click on Figure links to open figures in new window)
Sample #2a & 2b
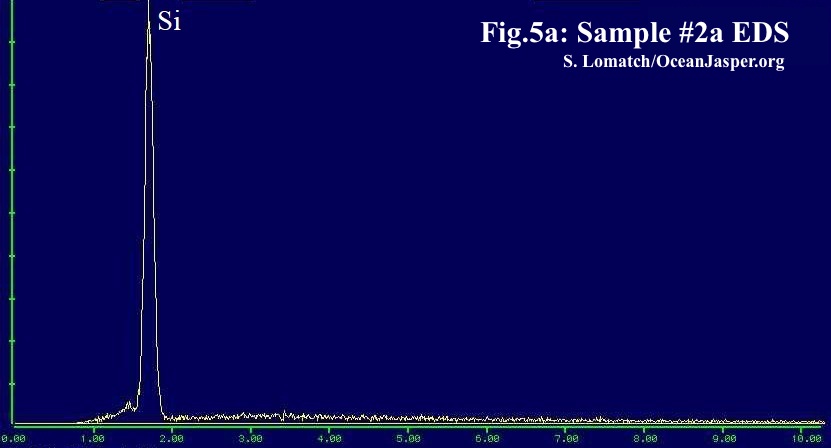
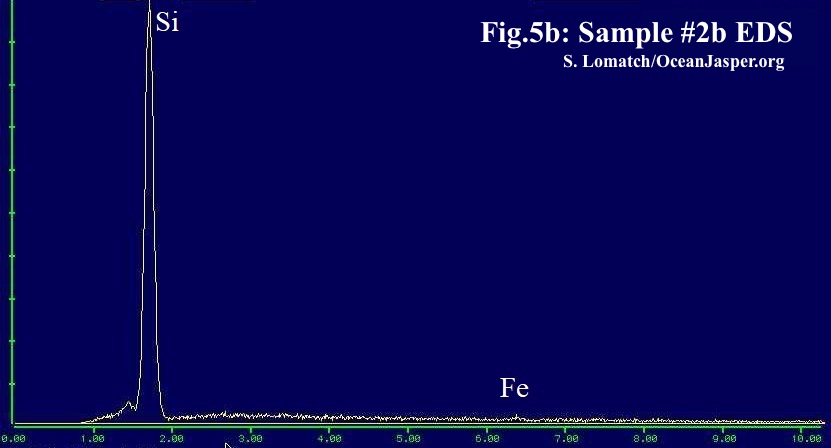
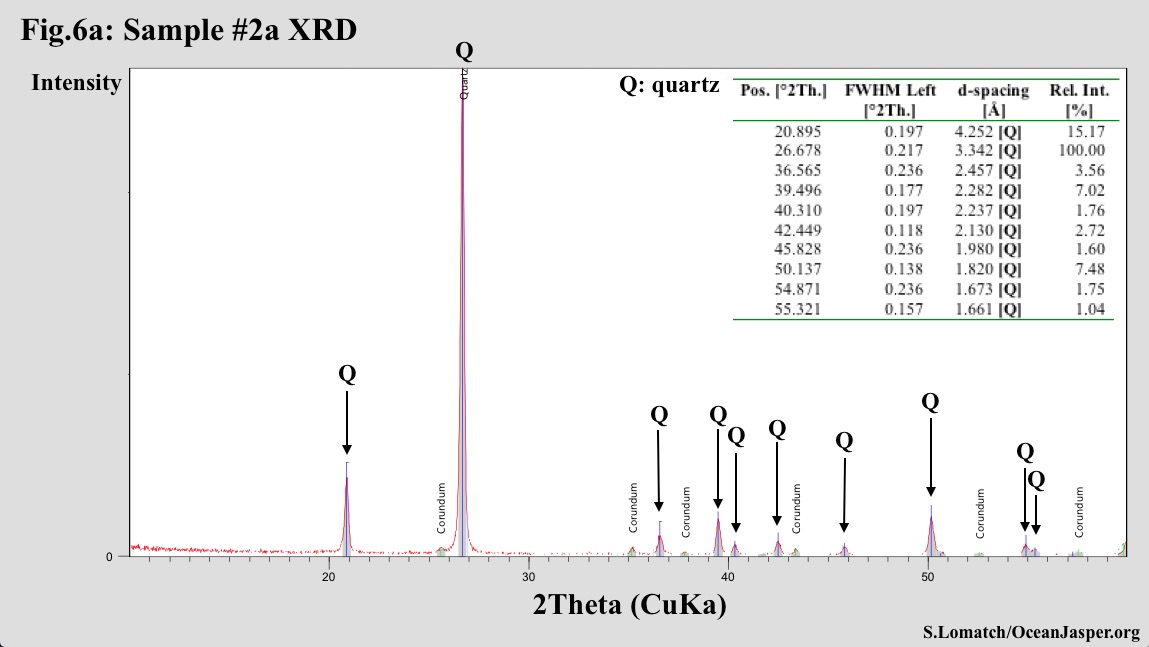
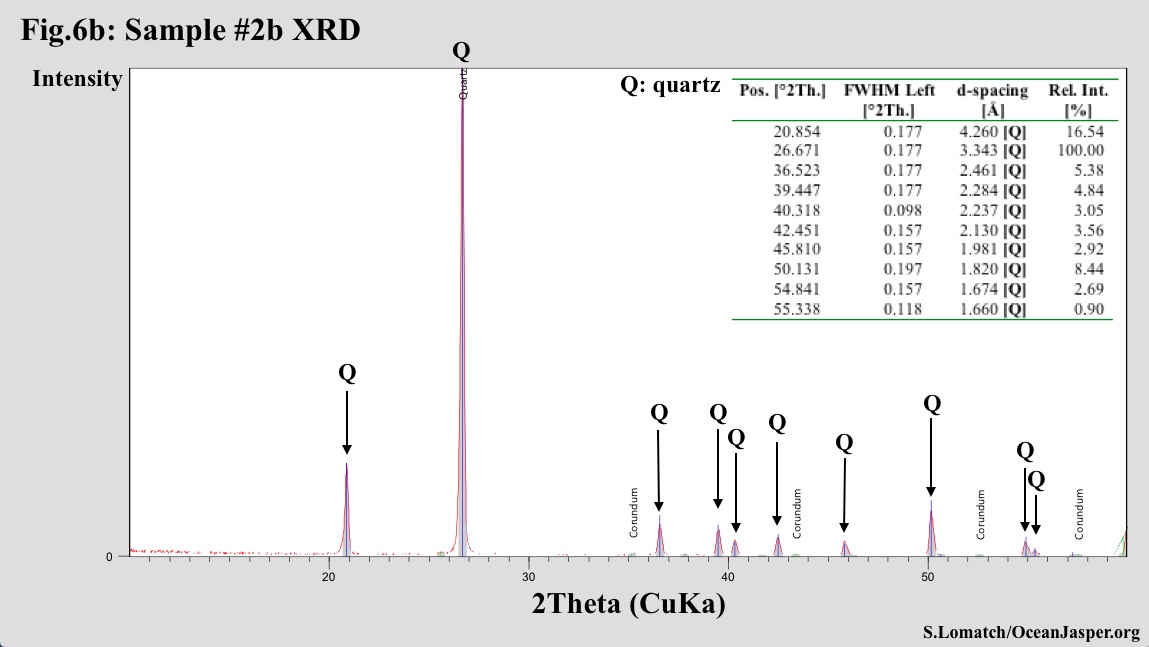
Both the orange “bullseye” spherulite Sample #2a and the surrounding green matrix Sample #2b are characterized as silica quartz (SiO2), with a trace amount of iron in Sample #2b, likely providing the green color, as indicated by the EDS spectra (Figs.5a,b) and the XRD diffractograms (Figs.6a,b). The XRD peak intensities of the secondary <1010> peaks at ~4.26Å are higher than those of Sample #1a (Fig.3a), and the FWHM of the main <1011> peak at 3.34Å much narrower, especially for Sample #2b (FWHM ~0.18°2Theta). The backgrounds in these XRDs are also lower. This may indicate a presence of macrocrystalline quartz or microcrystalline quartz of a granular variety in addition to chalcedony, but it may also indicate a chalcedony with a greater amount of crystalline order (less structural defects), different crystallite size, level of water, etc. that all contribute to the narrowing or broadening of chalcedony diffraction peaks [4,8]. The intensity of the tertiary <1122> reflection peaks (1.82Å) in Figs.6a,b are much lower than that of ideal alpha-quartz indicating a substantial level of chalcedony.
Fig.5a: Sample #2a – EDS
Fig.5b: Sample #2b – EDS
Fig.6a: Sample #2a – XRD
Fig.6b: Sample #2b – XRD
Sample #2c
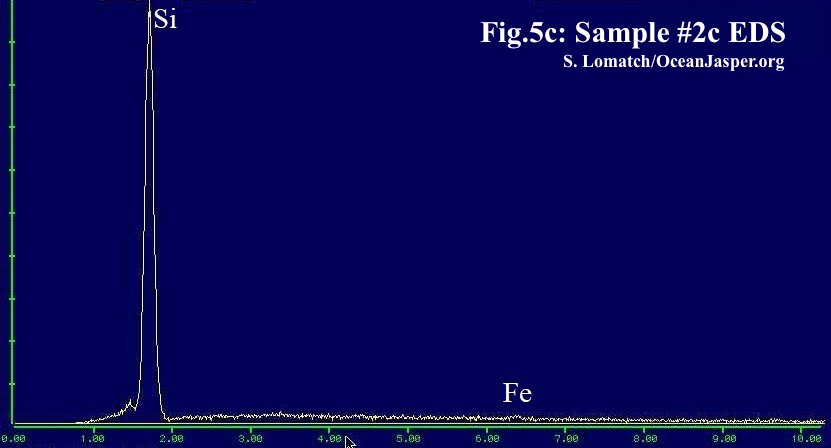
The light green matrix Sample #2c was characterized by EDS only (Fig.5c), and shows a similar spectrum to that of Sample #2b (Fig.5b).
Fig.5c: Sample #2c – EDS
Sample #2d
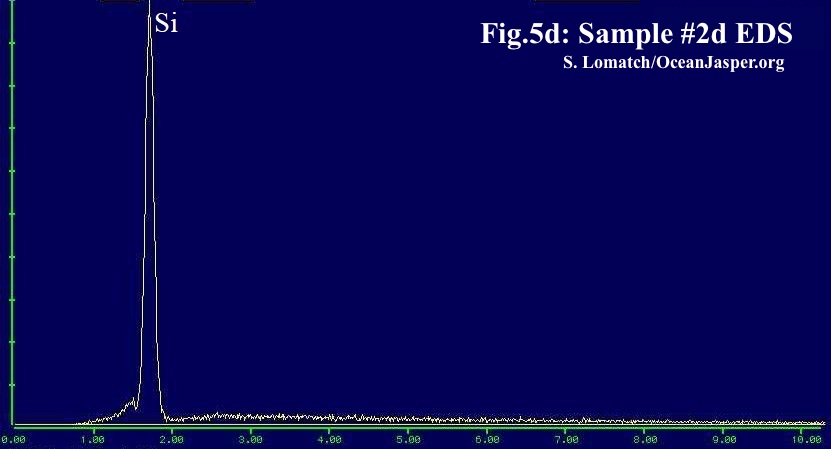
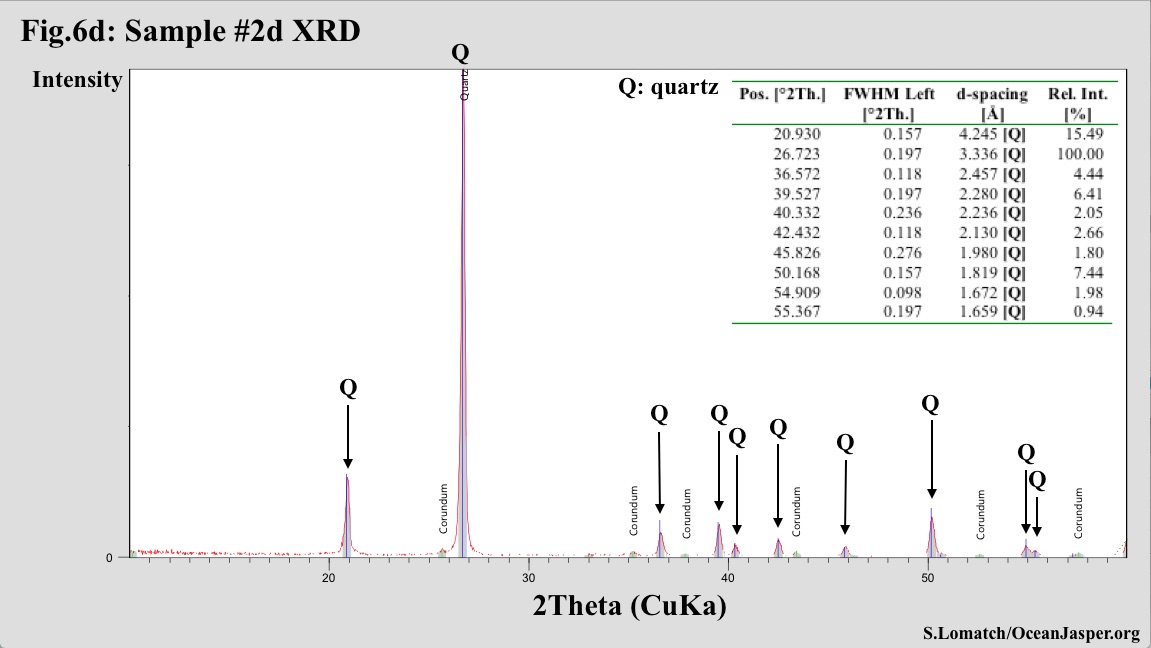
The bright opaque white Sample #2d (from the lacy texture feature) is characterized as silica quartz (SiO2) with no notable trace elements (Fig.5d) and a similar primary, secondary and tertiary XRD peak profile (Fig.6d) to Samples #2a & #2b.
Fig.5d: Sample #2d – EDS
Fig.6d: Sample #2d – XRD
Sample #2e
The clear translucent Sample #2e is characterized by XRD only (Fig.6e) as silica quartz (SiO2) with a narrow primary <1011> peak at 3.34Å and a broader secondary <1010> peak at 4.26Å of much lesser intensity than the other samples from this specimen. The background is slightly higher as well. This may indicate a greater amount of molecular and silanol group water in the chalcedony, known to influence diffraction peak intensity, width and background [4,5,7,8]. This type of translucent chalcedony is quite common in old stock Ocean Jasper.
Fig.6e: Sample #2e – XRD
It should again be noted that none of the XRDs from this specimen show weak peak reflections indicating moganite content, and the XRD primary/secondary/tertiary peak profiles together with the relatively low backgrounds indicate well-ordered microcrystalline chalcedony that may be intermixed with macrocrystalline quartz or microcrystalline quartz of a granular variety. Further characterization of all of these samples via high resolution imaging is needed to indicate level of chalcedony content and growth habits over macrocrystalline quartz and microcrystalline quartz of a granular variety.
SPECIMEN #3
The third specimen is a small slab of mostly opaque red-green matrix and a colorful patterning of yellow and red spherulites. This material was reportedly found among other old stock deposits off-shore, underground in the Marovato region during the later stages of mining (estimated mining period 2003-2004). Two samples were tested from the areas marked on the specimen photos (Fig.7) by XRD only (Fig.8).
Fig.7: Specimen #3 - Front
Fig.7: Specimen #3 - Top
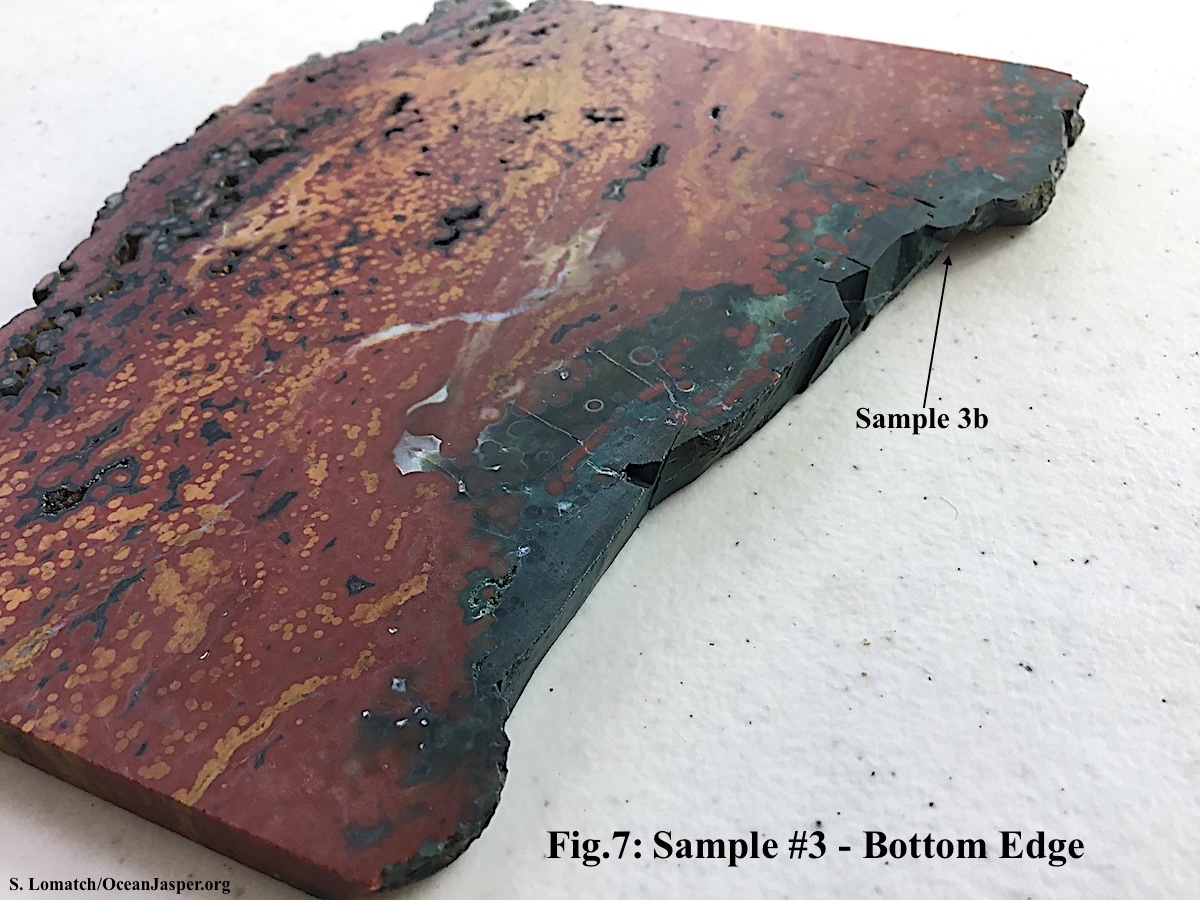
Fig.7: Specimen #3 – Bottom Edge
(Note: Right click on Figure links to open figures in new window)
Sample #3a
The small sample consisted of a mixture of red spherulites with surrounding green matrix from the top edge, in an area where the green matrix material was not so obviously of a druzy quartz character but an opaque green. Powder XRD results (Fig.8a) indicate silica quartz (SiO2) with a narrow primary and secondary reflection peaks and a secondary <1010> peak intensity at 4.24Å that is among the highest observed in these studies, and low background. Again, this may indicate a mixture of chalcedony, microcrystalline quartz of a granular variety, and macrocrystalline quartz.
Fig.8a: Sample #3a – XRD
Sample #3b
The small sample of opaque green matrix with a waxy luster was taken from the bottom edge of the specimen, adjacent to a few translucent areas with red spherulites. Powder XRD results (Fig.8b) indicate a mixed-mineral composition of silica polymorph tridymite and glauconite, the glauconite an iron potassium phyllosilicate (mica group) mineral which likely accounts for the green color. A high background in this XRD indicates additional amorphous content. No silica quartz of well-crystallized variety was observed. The presence of tridymite with a main peak approaching 4.12Å and broad main and secondary peaks (FWHM ~0.63-0.32°2Theta) with a high background may be indicative of Opal-CT of “T” variety. Ref. [5] shows an XRD of Opal-CT qualitatively similar to Fig.8b, and Ref. [13] makes a strong argument that such characterized variety of Opal-CT is better described as paracrystalline, “dominated by disordered material similar to amorphous opal (opal-A) but containing a small volume of crystalline stacking units which are mainly (sometimes exclusively) of a tridymitic nature.” An alternate possibility is that this sample contains disordered alpha-tridymite, as opposed to Opal-CT or “Opal-T”. As mentioned previously, there are several key tests that can be conducted to distinguish between Opal-CT and tridymite (likewise between Opal-C and cristobalite). These include sample annealing [5] and solubility in reagents [17] followed by another XRD test, as well as infrared Raman spectroscopy [16,18]. The Raman spectrum for natural orthorhombic alpha-tridymite is distinctly different from that of monoclinic alpha-tridymite and Opal-CT [16,18].
Fig.8b: Sample #3b – XRD
The incidence of glauconite in Sample #3b may be from a number of sources. Glauconite is known to form and occur almost exclusively in marine environments. Glauconite is usually associated with the diagenetic alteration of sedimentary deposits, however it is also noted as formed by the replacement of K-feldspars (e.g. orthoclase) [19]. It could be that glauconite deposited allogenically over time at the edge of this specimen, or over time it has replaced K-feldspar original to the formation of this specimen. As I have written about in Ref. [1], host rock identification and geological surveys near the original Marovato deposits/mines is largely missing, but this specimen, like the first specimen, show possible scant evidence of host rock composition. An original host rock of high-silica content with the presence of K-feldspars is associated with intrusive felsic granites.
A tridymite-glauconite admixture is the first known observation in Ocean Jasper. Further discussion of this edge Sample #3b and the other edge Samples #1b & #1c is included in the analysis & discussion section below.
SPECIMEN #4
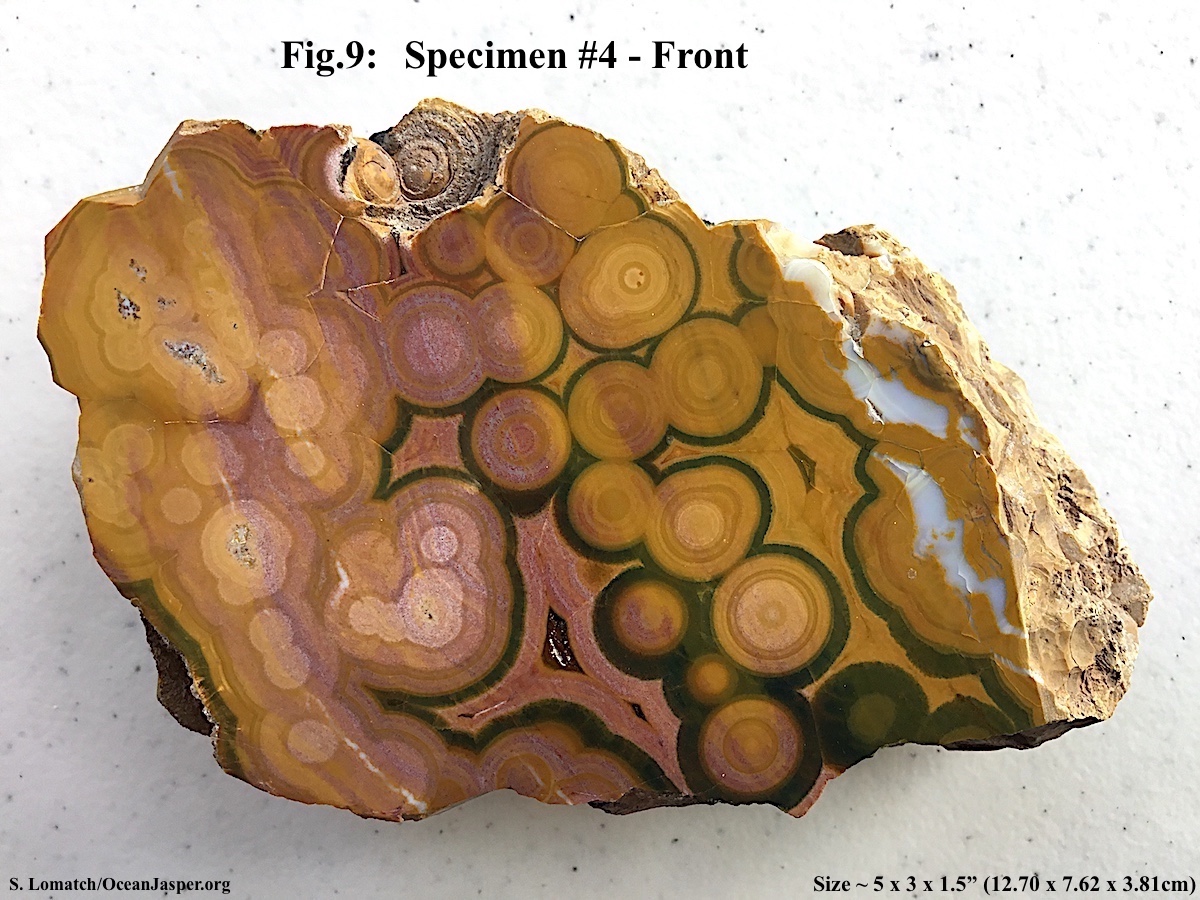
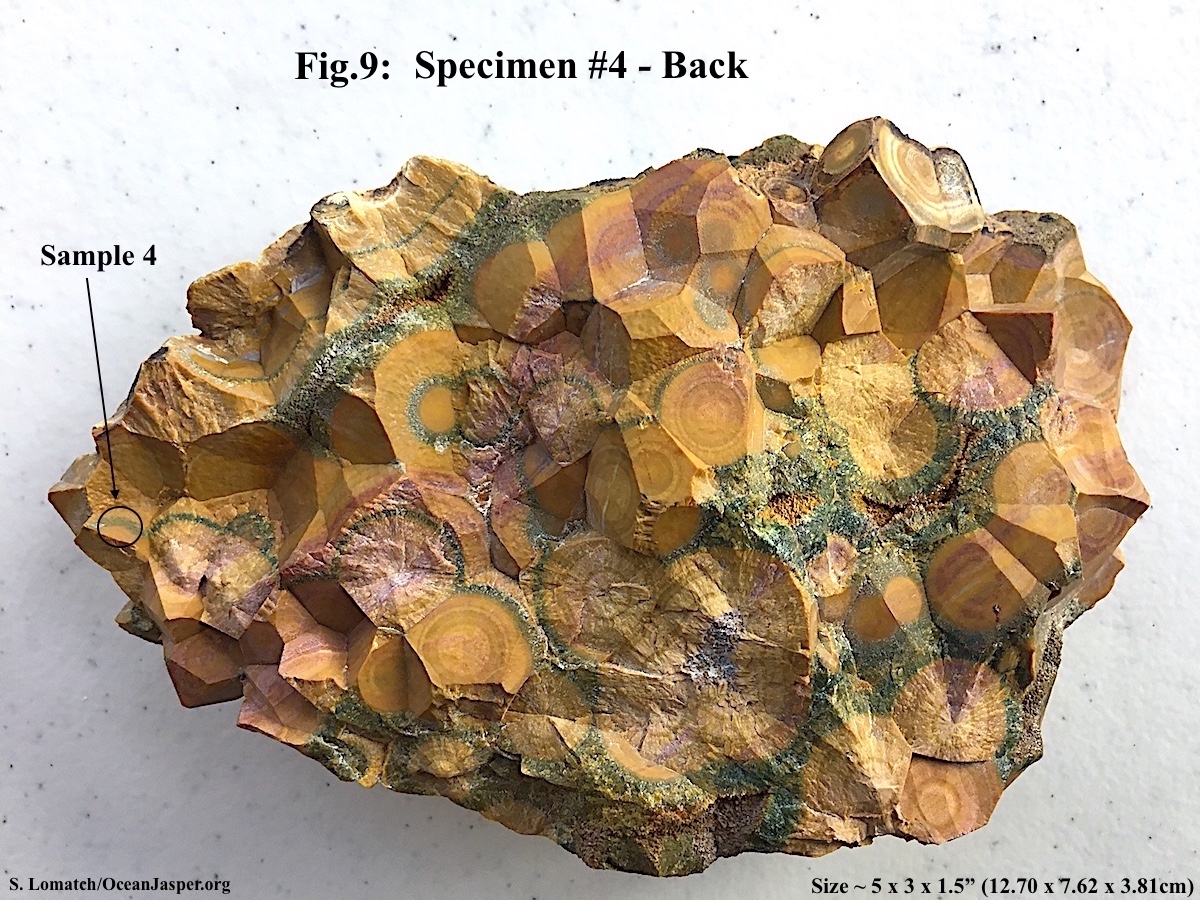
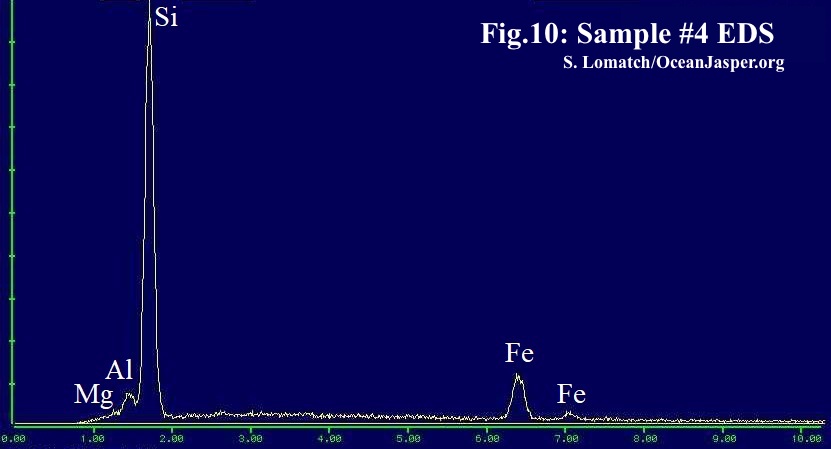
The fourth specimen is a classic large-spherulite variety from the Kabamby area, a surface collection area some 1.5 miles up the coast and inland from the old stock Marovato mines. One sample was tested from the back of this polished faced rough specimen, as shown in the specimen photos (Fig.9), by both EDS (Fig.10) and XRD (Fig.11).
Fig.9: Specimen #4 – Front
Fig.9: Specimen #4 – Back
Sample #4
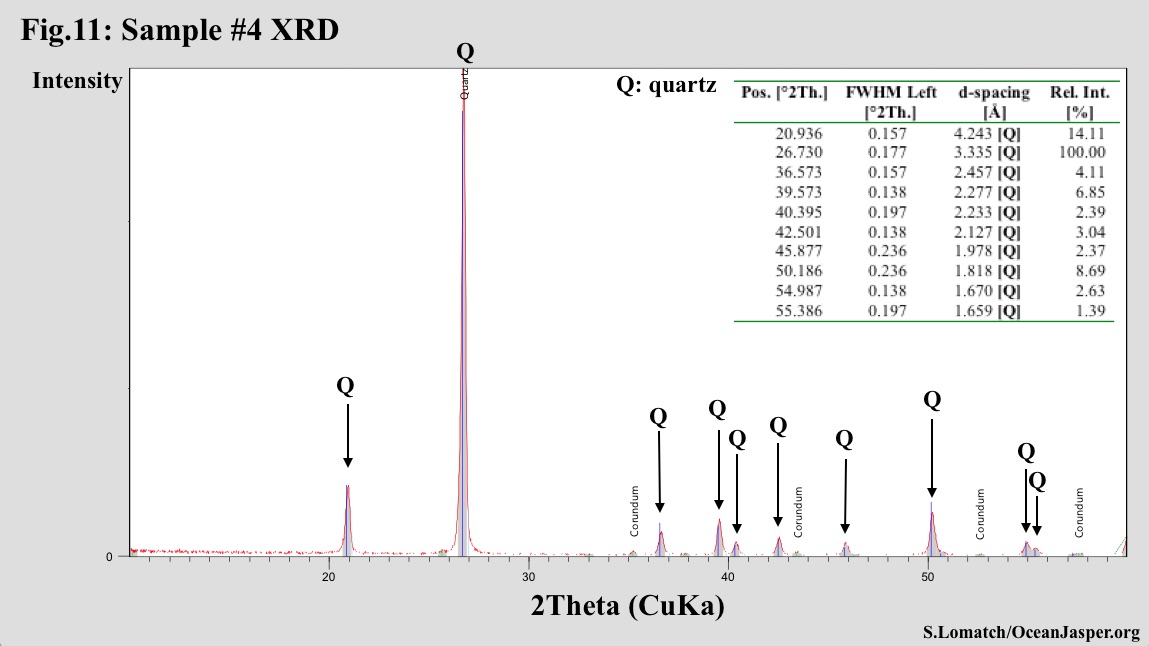
The small sample from the circle marked contained both the yellow spherulite material and the green ringed spherulite material. EDS and XRD results indicate silica quartz (SiO2) with trace amounts of iron likely accounting for the colors. The XRD main and secondary peaks are relatively narrow, and secondary and tertiary peak intensities are of moderate height compared to the same <1011> and <1122> reflection peaks in an ideal alpha-quartz specimen [4]. Similar Kabamby material was characterized earlier by optical microscopy using crossed polarizers, which showed a crystal growth habit of fibrous chalcedony [10]. Future studies on this specimen will include high resolution optical and SEM imaging to further quantify and classify growth habits.
Fig.10: Sample #4 – EDS
Fig.11: Sample #4 – XRD
SPECIMEN #5
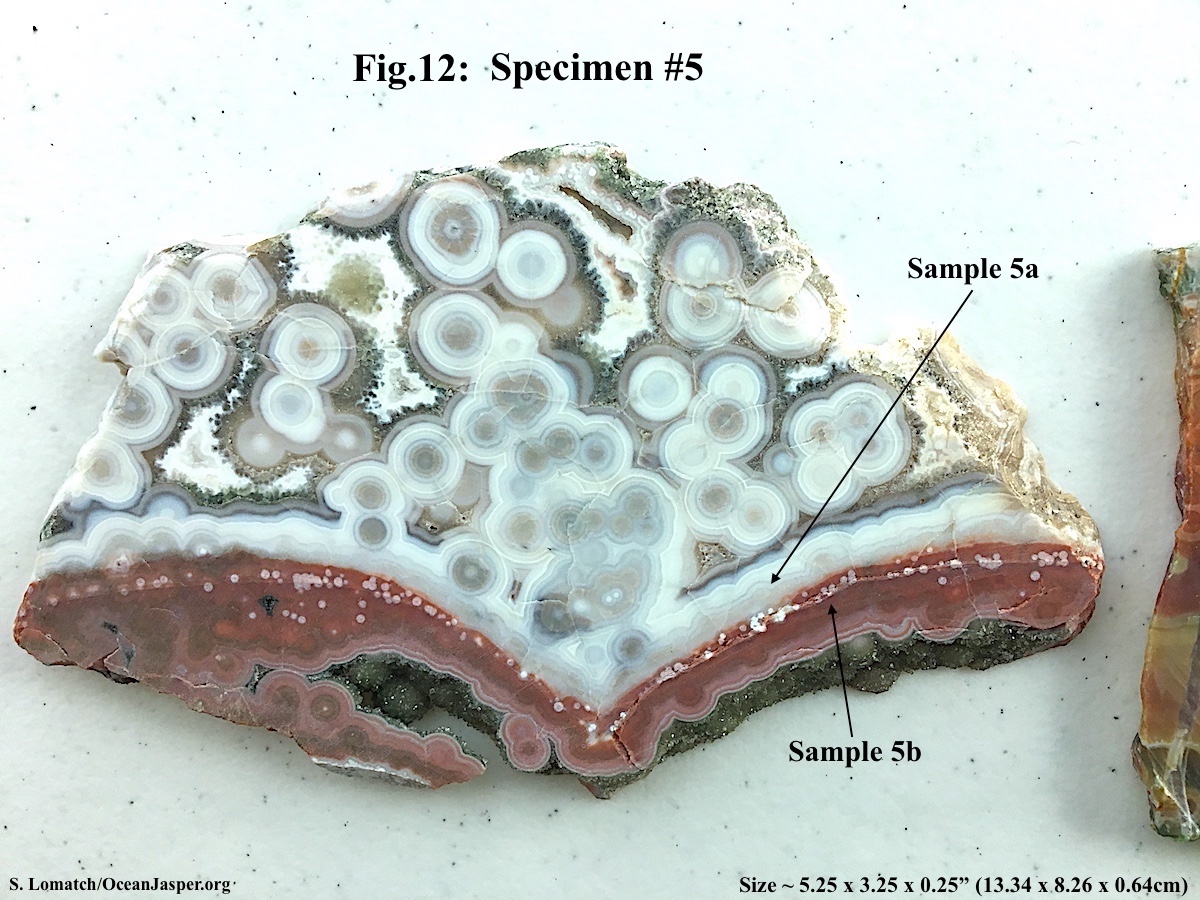
The fifth specimen is a small slab of rare old stock Ocean Jasper from off-shore, underground Marovato mines (estimated mining period 2003-2006), featuring large “bullseye” spherulites in a lacy chalcedony-quartz matrix, with horizontal agate-type banding along the bottom, numerous druzy pockets and quartz druzy growth on botryoidal chalcedony along the bottom edge. Two samples were tested from the areas marked in the specimen photo (Fig.12) by EDS only (Fig.13).
Fig.12: Specimen #5 - Front
Sample #5a
A small sample was taken from the banded gray-white area. The EDS spectrum (Fig.13a) indicates silica (SiO2).
Fig.13a: Sample #5a – EDS
Sample #5b
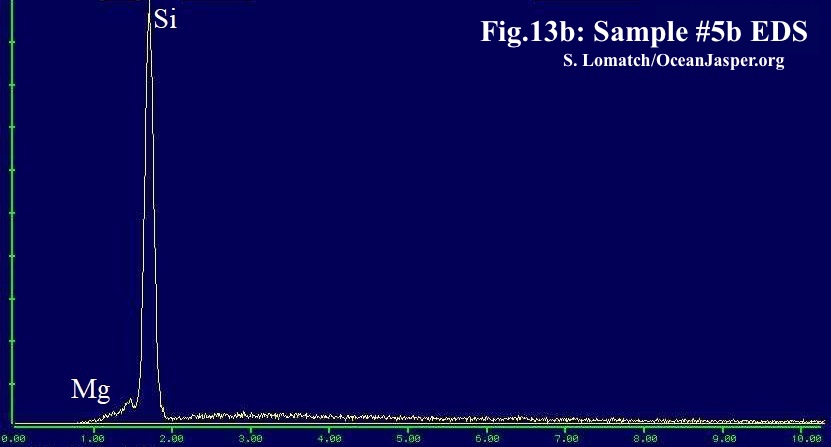
A small sample was taken from the reddish white spotted area. The EDS spectrum (Fig.13b) indicates silica (SiO2), for both the reddish area and the white spotted areas, with trace amounts of magnesium from the reddish area.
Fig.13b: Sample #5b – EDS
The plan is to conduct XRD tests on these samples, but the expectation is that the results will be similar to all others in this characterization study, indicating microcrystalline chalcedony.
SPECIMEN #6
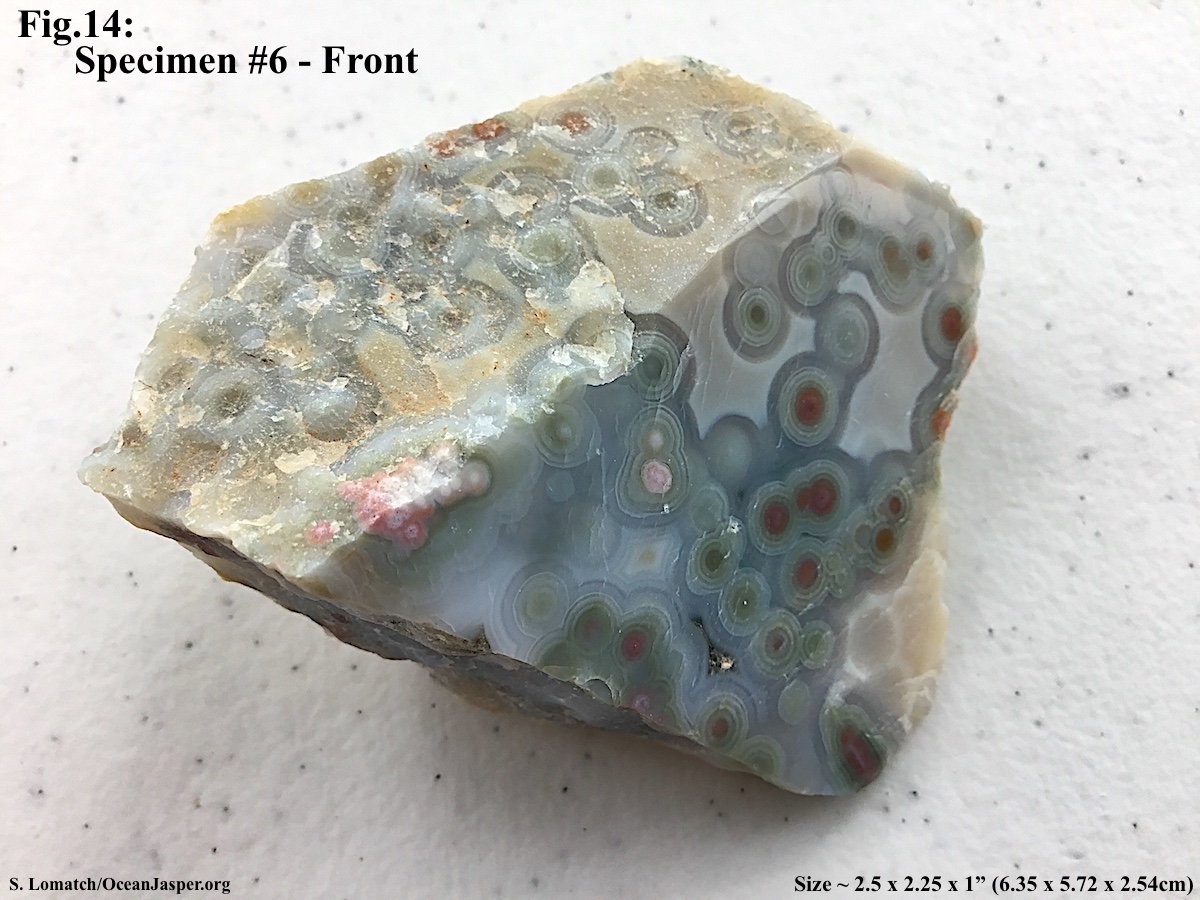
The sixth specimen is a small polished faced rough chunk from off-shore, underground Marovato mines (estimated mining period 2003-2006), featuring “bullseye” spherulites in a semi-translucent matrix, with rare colors and intricate patterning. One sample was tested from the area marked in the specimen photos (Fig.14) by EDS only (Fig.15).
Fig.14: Specimen #6 – Front
Fig.14: Specimen #6 – Back
Sample #6
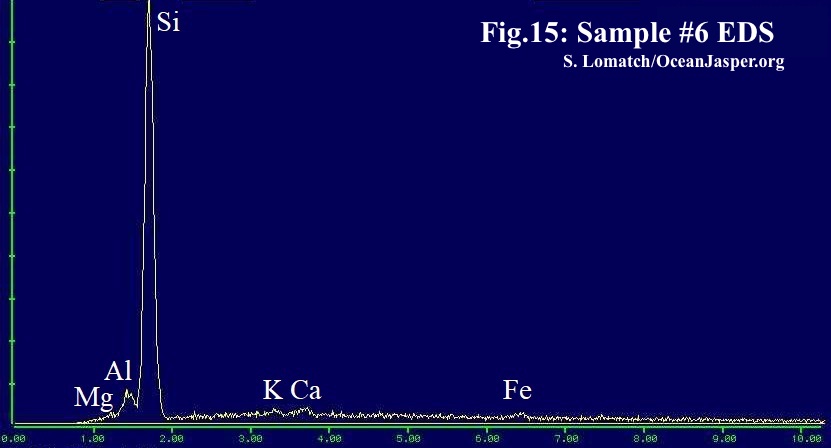
A small sample was taken from the rough back, of the tan matrix material only. The EDS spectrum (Fig.15) indicates silica (SiO2), with trace amounts of iron, calcium, potassium, aluminum and magnesium. An XRD will be conducted in the future, to indicate specifically which silica polymorph or quartz variety is present, but it is expected to be primarily chalcedony.
Fig.15: Sample #6 – EDS
SPECIMEN #7
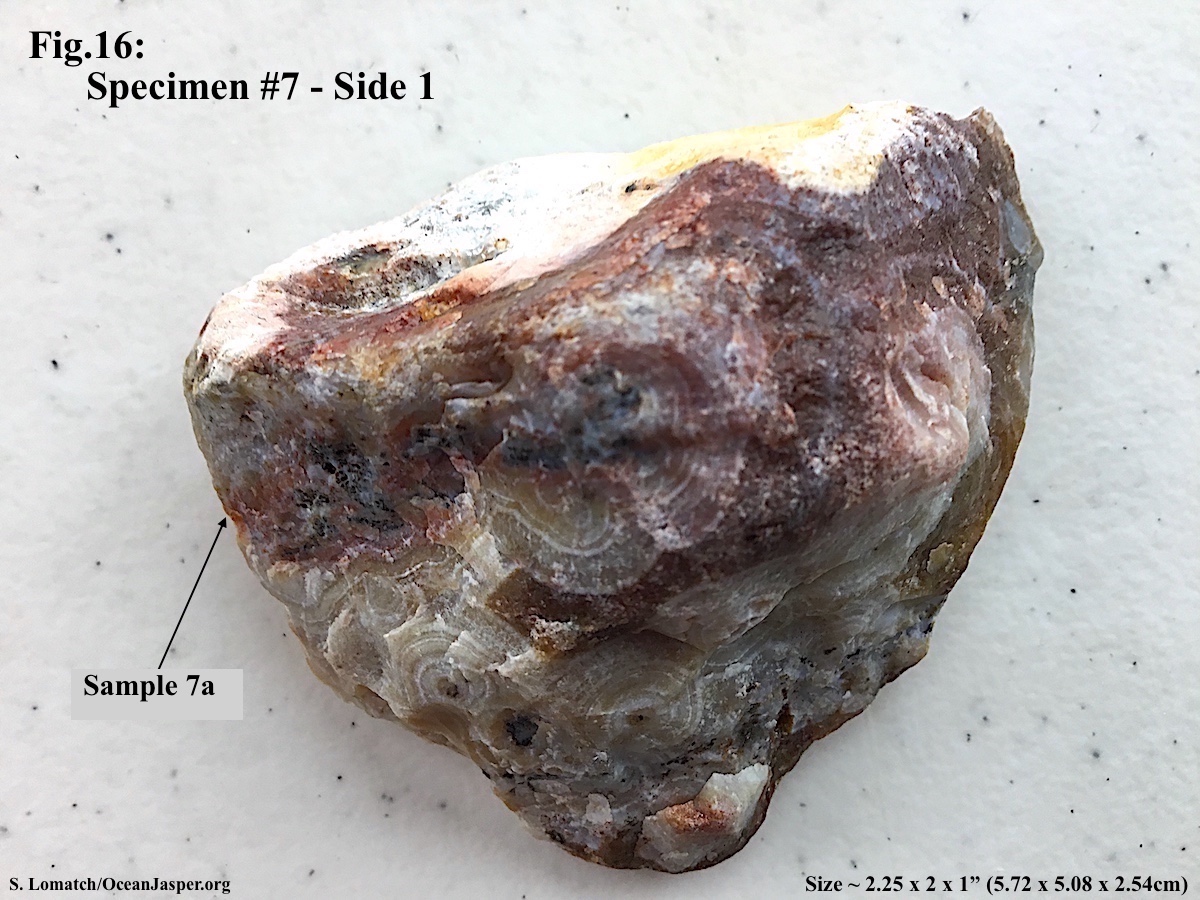
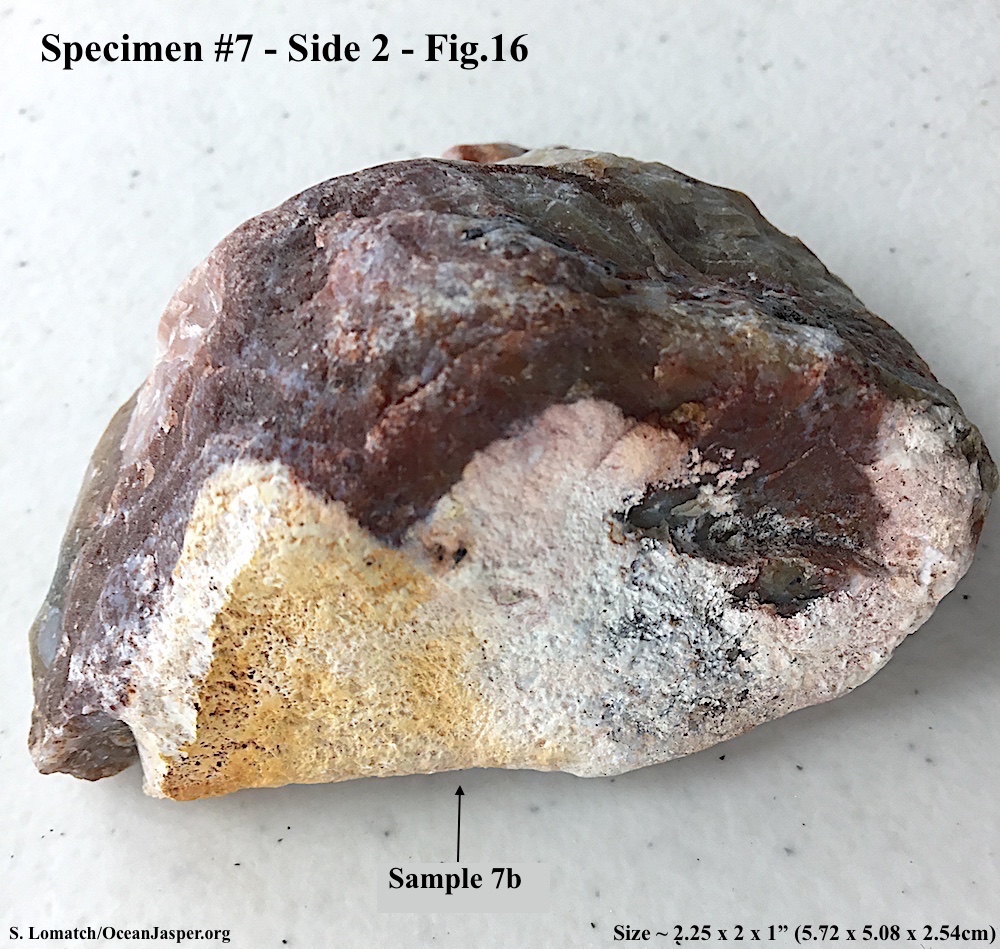
The seventh specimen is a small rough nugget from an unknown collection site in Madagascar, but likely from the Marovato area mines. Large bullseye-type banded spherulites are present in a semi-translucent matrix, and one side has what appears to be either a weathered edge or part of another rock type. Two samples were tested from the areas marked in the specimen photos (Fig.16) by EDS only (Fig.17).
Fig.16: Specimen #7 – Side 1
Fig.16: Specimen #7 – Side 2
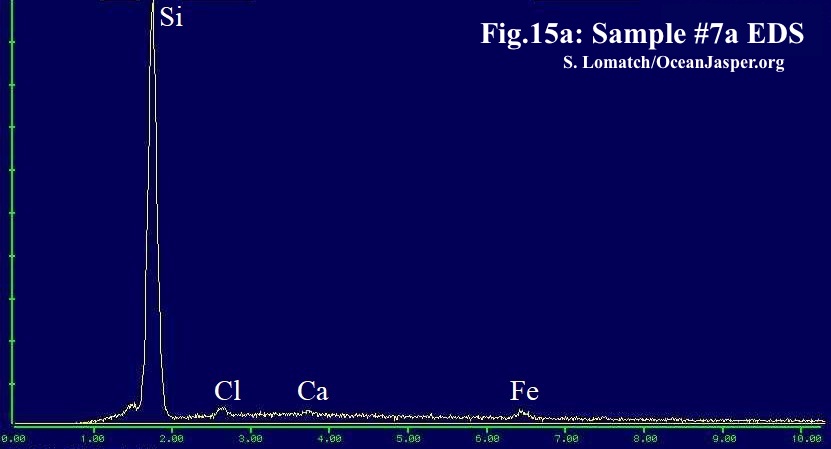
Sample #7a
A small sample was taken from the dark reddish semi-translucent area. The EDS spectrum (Fig.17a) indicates silica (SiO2) with a trace amount of iron likely accounting for the color. The chlorine and calcium weak peaks are probably from the detector.
Fig.17a: Sample #7a – EDS
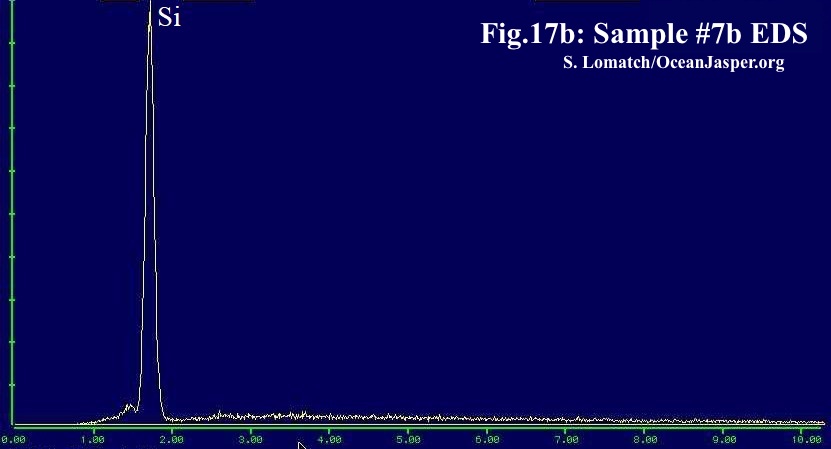
Sample #7b
A small sample was taken from the off-white weathered area. The EDS spectrum (Fig.17b) indicates silica (SiO2) only.
Fig.17b: Sample #7b – EDS
Future XRD and imaging tests will be conducted to indicate the specific silica polymorph or quartz variety present, particularly for the weathered edge, which appears to have a granular and spongy texture.
ANALYSIS & DISCUSSION
The seven specimens for this characterization study were chosen from a range of mostly old stock material, mined 2006 and earlier. The first three specimens (#1-3) were carefully selected rare stock from off-shore, underground mines near Marovato area, with two of these specimens (#1 and #3) exhibiting “edge” characteristics that might indicate more information regarding host rock and the general environment that supported original formation. It should be expressed to the reader that such “edge” features are rather difficult to find in rare high-grade old-stock (HGOS) Marovato specimens.
As discussed at length in Ref. [1], HGOS Ocean Jasper is a heterogeneous to hyper-heterogenous spherulitic chalcedony with many complex transitions in spherulite and matrix types that can span a contiguous range of a cu-ft and above, with no breaks of other rock types seen, including that of a “host rock”. Agate features (translucency, banding, fortification), jasper features (mostly opaque regions) and crystalline druzy quartz growth are intertwined in these complex, contiguous wide-area arrangements. Ocean Jasper is like nothing seen anywhere else in the petrographic world. Therefore, the goal is to quantifiably characterize this rare rock to better understand original formation.
Aside from the deviant “edge” characterization results of Specimens #1 & #3 (discussed at length below), the bulk of the specimen characterization results indicate silica quartz (SiO2) with trace iron for color, and the primary variety of silica quartz is microcrystalline chalcedony. The variable XRD diffractograms over ideal alpha-quartz [4] may indicate either a mixture of chalcedony with macrocrystalline quartz and/or microcrystalline quartz of a granular variety, or it may indicate a chalcedony with a greater amount of crystalline order (less structural defects), different crystallite size, level of water, etc. that all contribute to the intensity differences and narrowing or broadening of chalcedony diffraction peaks [4,8]. None of the weak reflection peaks indicating the presence of intergrown moganite were observed in any of the XRDs. Further study must include high resolution optical, SEM and TEM imaging to gauge microcrystalline growth habit features for the widely different spherulite types and matrix transitions in a single specimen, namely for Specimen #2.
The “edge” specimen samples, Samples #1b, #1c and #3b, all exhibit divergent characteristics from the bulk of the specimen, namely the presence of some crystalline level of higher silica polymorphs cristobalite and tridymite. As mentioned previously, their respective XRDs (Figs.3b,3c,8b) may indicate the presence of Opal-C and Opal-CT/T, since the XRD features are qualitatively similar to XRDs for Opal-C and Opal-CT [5]. However, the alternative of disordered alpha-(low)-cristobalite and alpha-(low)-tridymite cannot be ruled out, and must be seriously considered, as the XRD features for each are often not distinguishable without additional treatments and tests. Both alpha-cristobalite and alpha-tridymite are known to occur metastably in a high-silica rock matrix with such broadened peak-shifted XRD characteristics, which appears in volcanogenic cristobalite [14,15], volcanogenic tridymite [15,20,21], and tridymite and cristobalite found in clast-rich melt rock [16]. The conditions attributed to these occurrences of alpha-cristobalite and alpha-tridymite are consistently from a high-silica precursor rapidly cooled from high temperatures, not from a low-temperature diagenetic sedimentary process that produces Opal-C and Opal-CT/T.
There are several key tests that can be conducted to distinguish between Opal-C and cristobalite, and Opal-CT and tridymite. The first of these is sample annealing [5]. Opal-C and Opal-CT have been shown to exhibit measurable <101> and <002> reflection peak shifting post annealing (1 hour at 1350°C), much more so for Opal-CT. The greater the amount of “structural disorder” and amorphous character present in the opal specimen (such as for Opal-CT/T), the greater the post-annealing shift. For Opal-C, post-annealing shift of the <101> peak is much less than that observed for the corresponding tridymite primary <002> peak of Opal-CT/T. Both Opal-C and Opal-CT post annealing transform to a disordered cristobalite with a structural state between well-ordered cristobalite and Opal-C [5]. Therefore, this test can be used as a qualitative indication of Opal-C and Opal-CT vs. disordered alpha-cristobalite and alpha-tridymite in Samples #1b, #1b and #3b, since if these samples contain the latter and not the former, the post-annealing peak shifts would likely be minimal.
The second test is sample solubility in reagents, such as phosphoric acid, potassium pyrosulfate, and sodium sulfide solutions [17]. Amorphous opaline silicas are substantially more soluble in such reagents than crystalline silica polymorphs, e.g. cristobalite and tridymite, which are essentially insoluble. The test involves boiling the sample in the reagent and measuring the weight of the undissolved solid; additional XRD tests on the undissolved solid can be done to quantify post treatment changes. Ref. [17] shows via XRD that all traces of Opal-CT are removed from some opaline samples following this treatment, whereas other samples with crystalline cristobalite present show much less change.
Infrared spectroscopy is also an indicator for distinguishing between Opal-C, Opal-CT/T and alpha-(low) cristobalite, tridymite. Fourier transform infrared spectroscopy (FTIR) on alpha-cristobalite samples clearly shows a much stronger absorption band over Opal-C and Opal-CT samples [5,13]. The Raman spectrum for natural orthorhombic alpha-tridymite is distinctly different from that of monoclinic alpha-tridymite and Opal-CT [16,18].
High resolution microscopy (optical and electron) can be done on these divergent samples to determine level of crystallized silica polymorphs cristobalite/tridymite over amorphous opaline silicas. These tests are much more time consuming and costly in sample prep and testing than the three simpler tests described above, but a complete characterization would involve all of these testing modalities.
The observation of glauconite in addition to tridymite in Sample #3b may indicate a replacement over time of K-feldspars with glauconite [19]. An original host rock of high-silica content with the presence of K-feldspars is associated with intrusive felsic granites.
Finally, the goal of these characterizations is to better quantify and understand original formation of HGOS Ocean Jasper, both from the Marovato marine region and the inland Kabamby region, but particularly the rare large-scale deposits of hyper-heterogeneous spherulitic chalcedony from the off-shore, underground Marovato mines.
There are three distinct “host” environments that may account for the formation of this material:
(1) Extrusive volcanic processes, particularly devitrification of an obsidian lava flow that forms devitrification spherulites, followed by a weathering process that involves repeated changes in groundwater chemistry, dilution from an alkali-silica reaction, recrystallization, of silica polymer colloids into jasper, chalcedony and quartz, originating from obsidian [22];
(2) Intrusive volcanic processes, particularly a high-silica solution in a large host-rock chamber of felsic granite that undergoes rapid cooling followed by supersaturation of the attendant solution, nucleation and growth of spherulites, and hardening/crystallization of the silica polymer colloids into chalcedony, quartz, silica polymorphs (e.g. cristobalite and tridymite), and jasper, originating from the high silica solution [1];
(3) Diagenetic sedimentary processes, particularly those described in [23] involving the relatively low-temperature formation of Opal-CT and quartz from amorphous Opal-A, originating inorganically from amorphous opaline deposits and silcretes or organically from diatoms, radiolarians, silicoflagellates, sponges, and some terrestrial plants (biogenic silica).
I have discussed at length in Ref. [1] the favorable arguments supporting formation environment (2) over that of (1), on various grounds that I will not include in this characterization paper. A few of those arguments may be used to diminish or rule out (3), namely the character of deposits of large-scale contiguous, well-crystallized specimen structures of hyper-heterogenous spherulitic/matrix complexity found near Marovato. Such low-temperature processes of (3) that are replete elsewhere have never produced these kinds of structures elsewhere.
“These speculations await direct empirical validation.”
NEXT-STEP CHARACTERIZATION TESTS
The following is a comprehensive list of “next-step” characterization tests on each of the specimen samples and the expected benefit. Once these are completed, a second part characterization paper will be published.
Qualitative SEM/EDS and powder XRD tests were conducted first, as they represent quick and relatively inexpensive test modes to determine compositional and crystallographic information for each specimen sample. Samples were carefully chosen from each specimen to convey the most generalizable information about the specimen as a whole.
This characterization study was completed using specimens from the author’s collection, and funds donated by the author for all test costs.
The “next-step” tests outlined below represent a much costlier set of tests, particularly high-resolution imaging in all modalities. Sample preparation is also much more challenging, requiring thin sections that are optically flat. Though I have identified at least one possible testing facility for each test below, I am also looking for any additional recommendations for test facilities, particularly ones that might be less expensive than those I have already sourced. Recommendations from Readers are appreciated greatly; please contact me below (*).
High Resolution Microscopy/Imaging
Optical (mm, sub-mm scales; crossed polarization included)
SEM (µm and sub-µm scales)
TEM (nm scale)
Benefits: Resolution of crystal groups and growth habits at each successive scale, for spherulites and the surrounding matrix, plus the divergent “edge” samples
Infrared Spectroscopy
FTIR
Raman
Benefits: Partially definitive distinction between Opal-C, Opal-CT/T and alpha-cristobalite and alpha-tridymite; ability to measure short-range order and characterize both disordered crystalline and amorphous materials with short-range order
Annealing & Reagent Solubility Tests, followed by Powder XRD
Benefits: Partially definitive distinction between Opal-C, Opal-CT/T and alpha-cristobalite and alpha-tridymite; complementary to infrared spectroscopy
–––––––
*Contact information: contact[at]oceanjasper.org
Funding for this study provided by: Susanne Lomatch
Website: OceanJasper.org
REFERENCES:
[1] “Ocean Jasper: A Natural Wonder and a Geological Mystery,” Susanne Lomatch, Oct. 31, 2019, KDP Publishing [https://www.amazon.com/Ocean-Jasper-Natural-Geological-Mystery/dp/1703393511/ref=tmm_pap_swatch_0?_encoding=UTF8&qid=&sr=]
[2] EDS/SEM results on samples sent to Kerry Day of Kaygeedee Minerals, Ottawa, Canada
[3] Powder XRD results on samples sent to John Attard of Attard’s Minerals, San Diego, CA
[4] “Structural Defects in Microcrystalline Silica,” H.A. Graetsch, O.W. Flörke, and G. Miehe,
Physics and Chemistry of Minerals, v.14(3), p.249-257, 1987
[5] “Nomenclature of micro- and non-crystalline silica minerals, based on structure and microstructure,” O.W. Flörke, et al., Neues Jahrbuch für Mineralogie – Abhandlungen, v.163, p.19-42, 1991
[6] “Structural characteristics of opaline and microcrystalline silica minerals,” H.A. Graetsch, Reviews in Mineralogy and Geochemistry, Silica, v.29, p.209-232, 1994
[7] “A proposed mechanism for the growth of chalcedony,” P.J. Heaney, Contributions to Mineralogy and Petrology, v.115, p.66-74, 1993
[8] “Structural disparities between chalcedony and macrocrystalline quartz,” P.J. Heaney, D.R. Veblen, and J.E. Post, American Mineralogist, v.79, p.452-460, 1994
[9] “Electrical and optical properties of chalcedony and striped chalcedony, A. Çetin, et al., Vacuum, v.97, p.75-80, 2013
[10] Matthews, C., “The Geology, Varieties and History of Ocean Jasper, Part I,” Enter the Earth Blog, January 2015. [http://www.entertheearth.com/the-geology-varieties-and-history-of-ocean-jasper-part-one]
[11] Strekeisen, A. See website http://www.alexstrekeisen.it/english/meta/oceanjasper.php for numerous polarized light microphotographs of Ocean Jasper samples showing spherulites and fibrous chalcedony with irregular polygon boundaries.
[12] “NMR, XRD and IR study on microcrystalline opals,” H. Graetsch, H. Gies, and I. Topalovic, Physics and Chemistry of Minerals, v.21, p.166-175, 1994
[13] “The structure of opal-CT revisited,” M.J. Wilson, Journal of Non-Crystalline Solids, v.405, p.68-75, 2014. This review has many references to a large body of earlier characterization work on Opal-C and Opal-CT.
[14] “The a–b phase transition in volcanic cristobalite,” D.E. Damby, et al., Journal of Applied Crystallography, v.47, p.1205-1215, 2014
[15] “The structure and texture of Opal-CT and Opal-C in volcanic rocks,” T. Nagase & M. Akizuki, The Canadian Mineralogist, v.35, p.947-958, 1997
[16] “Monoclinic tridymite in clast-rich impact melt rock from the Chesapeake Bay impact,” J.C. Jackson, et al., American Mineralogist, v.96, p.81-88, 2011
[17] “Distinguishing opaline silica from cristobalite in bentonites: a practical procedure and perspective based on NaOH dissolution,” S. Hiller & D.G. Lumsdon, Clay Minerals, v.43, p.477-486, 2008
[18] “Structural state of microcrystalline opals: A Raman spectroscopic study,” A. Ilieva, et al., American Mineralogist, v.92, p.1325-1333, 2007
[19] “Origin and geochemical characterization of the glauconites in the Upper Cretaceous Lameta Formation, Narmada Basin, central India,” U. Bansal, et al., Journal of Palaeogeography, v.7(2), p.99-116, 2018
[20] “The first finding of monoclinic tridymite in terrestrial volcanic rocks,” K. Kawai, et al., Mineralogical Journal, v.9(4), p.231-235, 1978
[21] “The significance of tridymite in igneous and metamorphic petrogenesis,” G.P. Black, Mineral Mag v.30(227), p.518–524, 1954
[22] “Banded Agates: A Genetic Approach,” M. Campos-Venuti, Edizioni AccorpaMente, 2018
[23] “Silica diagenesis II: General mechanisms,” L.A. Williams & D.A. Crerar, Journal of Sedimentary Petrology, v.55(3), p.312-321, 1985
Author: Susanne Lomatch*
In this article I present the first known compositional (SEM/EDS) and crystallographic (XRD) characterization studies for 7 specimens of old stock Ocean Jasper. I provide an analysis of the results and I identify a series of next-step characterization tests.
Ocean Jasper is a rare orbicular rock uniquely from Madagascar, classified as a “spherulitic chalcedony”. The rarer high-grade varieties are “old stock”, mined between 2001-2006, mines depleted and no publicly known similar quality veins found since. Feature descriptions, grade classifications, large-format specimen photos, and an extensive discussion of geological information and possible formation are discussed in [1].
Compositional tests reported in this article were done by qualitative energy dispersive x-ray spectroscopy (EDS) via scanning electron microscopy (SEM) using a Cambridge S100 SEM, a XR-100-CR pin diode detector and DTSA software, 25 Kev accelerating voltage [2]. Crystallography tests reported were done by powder x-ray diffraction (XRD) using standard copper Kα radiation diffractometry [3].
SPECIMEN #1
The first specimen is a thick slabbed chunk of ultra-rare old stock Ocean Jasper from off-shore, underground Marovato mines (estimated mining period 2001-2003) with large “bullseye” and compound semi-translucent spherulites in a mixed color semi-translucent chalcedony matrix. The specimen has an outer “rind” of weathered material along the bottom edge and crystalline quartz druzy along the top edge. Three samples were tested from the areas marked in the specimen photos (Fig.1). All three samples were tested by both EDS (Fig.2) and XRD (Fig.3).
Fig.1: Specimen #1 - Front
Fig.1: Specimen #1 - Front-Left
Fig.1: Specimen #1 - Side
Fig.1: Specimen #1 - Bottom
(Note: Right click on Figure links to open figures in new window)
Sample #1a
The results show that the orbicular “bullseye” spherulite sample (Sample #1a) is silica quartz (SiO2), no other appreciable elements or minerals present (Figs.2a&3a) other than a trace amount of iron (Fe) that contributes to the color. Since the XRD for chalcedony is almost identical to that of SiO2 quartz [4-9], the XRD characterization (Fig.3a) indicates chalcedony, given that past optical microscopy of spherulites in this material [1,10,11] show fibrous microcrystalline SiO2 (chalcedony) growth of spherulites, though I submit that further imaging characterization should be done on these specimen samples via high-resolution SEM and transmission electron microscopy (TEM), to verify detailed growth characteristics of the spherulites vs. the surrounding matrix. The sharp peaks in the XRD (Fig.3a) with minimal background but slightly broadened (FWHM) peaks over ideal alpha-quartz indicate an ordered microcrystalline chalcedony [4]. The smaller relative intensities of the <1010> secondary peak (4.23Å) and <1122> tertiary peak (1.82Å) compared to ideal alpha-quartz are such an indication. Fig. 3a does not show characteristic SiO2 polymorph moganite peak reflections seen in some samples of chalcedony – these are weak reflections at d-spacings 4.46Å (20.0°), 3.09Å (28.6°) and 2.91Å (31.0°) [4]. It is known that moganite has a structure that can be described as an alternate stacking of left- and right-handed quartz, and can be found intergrown with chalcedony at the twin boundaries; this phase is observed in some samples of chalcedony that under high resolution imaging show length-slow fibrous growth. These additional weak reflections indicating intergrown moganite were not observed in any of the XRDs of samples in this characterization study, including Sample #1a. Only a subset of natural chalcedony samples shows intergrown moganite characteristics [8,9]. I should note that this sample required powder grinding with corundum (Mohs 9+), and that this type of compound spherulite is the hardest of the surrounding material. This was also observed for a similar compound spherulite in another specimen (Specimen #2, Sample #2a).
Fig.2a: Sample #1a – EDS
Fig.3a: Sample #1a – XRD
Sample #1b & 1c
Samples #1b and #1c show an EDS (Figs.2b &2c) indicating silica (SiO2) with trace amounts of potassium/calcium (K/Ca), more so in the edge/weathered Sample #1c, which shows additional trace amounts of sodium/aluminum (Na/Al), magnesium (Mg), and sulfur (S). The trace amount of iron (Fe) in both samples likely accounts for the green color. The EDS detector efficiency
peaks at Ca, thus, all Ca peaks are exaggerated [2]. The XRD results indicate that Sample #1b & 1c are a composite of SiO2 quartz (chalcedony) and alpha-(low)-cristobalite, an estimated 92/8% admixture in #1b and 82/18% admixture in #1c. The first question one will ask is what is the source of the cristobalite. The main peak intensity for natural alpha-cristobalite is 4.04Å, FWHM ~0.09°2Theta; these samples show a main peak at ~4.08Å, FWHM ~0.47° and ~0.39° respectively, and a broadened background, all of which might indicate Opal-C or Opal-CT [12], not crystalline alpha-cristobalite. It is known that the XRD characteristics of disordered alpha-cristobalite can mimic those of Opal-C and a more ordered Opal-CT [12,13]. My guess is that it is not Opal-C or Opal-CT, but disordered low-cristobalite that can occur metastably, and also possibly intergrown with the fibrous chalcedony inherent in this material. Evidence supporting this conjecture was found in a literature search of occurrences of natural alpha-cristobalite in a high-silica rock matrix with such broadened peak-shifted XRD characteristics, which appears in volcanogenic cristobalite [14,15] and cristobalite found in clast-rich melt rock [16]. The conditions attributed to these occurrences of alpha-cristobalite are consistently from a high-silica precursor rapidly cooled from high temperatures. This conjecture can only be affirmed by doing additional studies, namely high-resolution SEM or TEM imaging studies, infrared spectroscopy and a few other specific tests. These are among the “next-step” tests that I recommend for similar samples from this specimen. A microcrystalline quartz-cristobalite admixture is the first known observation in Ocean Jasper. I include an extended discussion of this observation and speculations in the discussion and analysis section below.
Readers should note that trace amounts of Na/Al/K detected in EDS spectra of Samples #1b and #1c can be attributed to the propensity of alpha-cristobalite (and of Opal-C) to incorporate impurities via substitutions of Na, Al and K ions for Si [4,14].
Fig.2b: Sample #1b – EDS
Fig.2c: Sample #1c – EDS
Fig.3b: Sample #1b – XRD
Fig.3c: Sample #1c – XRD
SPECIMEN #2
The second specimen is a slab of ultra-rare “hyper-heterogeneous” type old stock Ocean Jasper from off-shore, underground Marovato mines (estimated mining period 2001-2003) that shows several transitions of spherulite and matrix features inherent in the highest grades of old stock material. Five samples were tested from the areas marked in the specimen photo (Fig.4). Three samples (Samples #2a, 2b, 2d) were tested by both EDS (Figs.5a,b,d) and XRD (Figs.6a,b,d); one sample (Sample #2c) by EDS only (Fig.5c), and one sample (Sample #2e) by XRD only (Fig.6e).
Fig.4: Specimen #2 - Front
(Note: Right click on Figure links to open figures in new window)
Sample #2a & 2b
Both the orange “bullseye” spherulite Sample #2a and the surrounding green matrix Sample #2b are characterized as silica quartz (SiO2), with a trace amount of iron in Sample #2b, likely providing the green color, as indicated by the EDS spectra (Figs.5a,b) and the XRD diffractograms (Figs.6a,b). The XRD peak intensities of the secondary <1010> peaks at ~4.26Å are higher than those of Sample #1a (Fig.3a), and the FWHM of the main <1011> peak at 3.34Å much narrower, especially for Sample #2b (FWHM ~0.18°2Theta). The backgrounds in these XRDs are also lower. This may indicate a presence of macrocrystalline quartz or microcrystalline quartz of a granular variety in addition to chalcedony, but it may also indicate a chalcedony with a greater amount of crystalline order (less structural defects), different crystallite size, level of water, etc. that all contribute to the narrowing or broadening of chalcedony diffraction peaks [4,8]. The intensity of the tertiary <1122> reflection peaks (1.82Å) in Figs.6a,b are much lower than that of ideal alpha-quartz indicating a substantial level of chalcedony.
Fig.5a: Sample #2a – EDS
Fig.5b: Sample #2b – EDS
Fig.6a: Sample #2a – XRD
Fig.6b: Sample #2b – XRD
Sample #2c
The light green matrix Sample #2c was characterized by EDS only (Fig.5c), and shows a similar spectrum to that of Sample #2b (Fig.5b).
Fig.5c: Sample #2c – EDS
Sample #2d
The bright opaque white Sample #2d (from the lacy texture feature) is characterized as silica quartz (SiO2) with no notable trace elements (Fig.5d) and a similar primary, secondary and tertiary XRD peak profile (Fig.6d) to Samples #2a & #2b.
Fig.5d: Sample #2d – EDS
Fig.6d: Sample #2d – XRD
Sample #2e
The clear translucent Sample #2e is characterized by XRD only (Fig.6e) as silica quartz (SiO2) with a narrow primary <1011> peak at 3.34Å and a broader secondary <1010> peak at 4.26Å of much lesser intensity than the other samples from this specimen. The background is slightly higher as well. This may indicate a greater amount of molecular and silanol group water in the chalcedony, known to influence diffraction peak intensity, width and background [4,5,7,8]. This type of translucent chalcedony is quite common in old stock Ocean Jasper.
Fig.6e: Sample #2e – XRD
It should again be noted that none of the XRDs from this specimen show weak peak reflections indicating moganite content, and the XRD primary/secondary/tertiary peak profiles together with the relatively low backgrounds indicate well-ordered microcrystalline chalcedony that may be intermixed with macrocrystalline quartz or microcrystalline quartz of a granular variety. Further characterization of all of these samples via high resolution imaging is needed to indicate level of chalcedony content and growth habits over macrocrystalline quartz and microcrystalline quartz of a granular variety.
SPECIMEN #3
The third specimen is a small slab of mostly opaque red-green matrix and a colorful patterning of yellow and red spherulites. This material was reportedly found among other old stock deposits off-shore, underground in the Marovato region during the later stages of mining (estimated mining period 2003-2004). Two samples were tested from the areas marked on the specimen photos (Fig.7) by XRD only (Fig.8).
Fig.7: Specimen #3 - Front
Fig.7: Specimen #3 - Top
Fig.7: Specimen #3 – Bottom Edge
(Note: Right click on Figure links to open figures in new window)
Sample #3a
The small sample consisted of a mixture of red spherulites with surrounding green matrix from the top edge, in an area where the green matrix material was not so obviously of a druzy quartz character but an opaque green. Powder XRD results (Fig.8a) indicate silica quartz (SiO2) with a narrow primary and secondary reflection peaks and a secondary <1010> peak intensity at 4.24Å that is among the highest observed in these studies, and low background. Again, this may indicate a mixture of chalcedony, microcrystalline quartz of a granular variety, and macrocrystalline quartz.
Fig.8a: Sample #3a – XRD
Sample #3b
The small sample of opaque green matrix with a waxy luster was taken from the bottom edge of the specimen, adjacent to a few translucent areas with red spherulites. Powder XRD results (Fig.8b) indicate a mixed-mineral composition of silica polymorph tridymite and glauconite, the glauconite an iron potassium phyllosilicate (mica group) mineral which likely accounts for the green color. A high background in this XRD indicates additional amorphous content. No silica quartz of well-crystallized variety was observed. The presence of tridymite with a main peak approaching 4.12Å and broad main and secondary peaks (FWHM ~0.63-0.32°2Theta) with a high background may be indicative of Opal-CT of “T” variety. Ref. [5] shows an XRD of Opal-CT qualitatively similar to Fig.8b, and Ref. [13] makes a strong argument that such characterized variety of Opal-CT is better described as paracrystalline, “dominated by disordered material similar to amorphous opal (opal-A) but containing a small volume of crystalline stacking units which are mainly (sometimes exclusively) of a tridymitic nature.” An alternate possibility is that this sample contains disordered alpha-tridymite, as opposed to Opal-CT or “Opal-T”. As mentioned previously, there are several key tests that can be conducted to distinguish between Opal-CT and tridymite (likewise between Opal-C and cristobalite). These include sample annealing [5] and solubility in reagents [17] followed by another XRD test, as well as infrared Raman spectroscopy [16,18]. The Raman spectrum for natural orthorhombic alpha-tridymite is distinctly different from that of monoclinic alpha-tridymite and Opal-CT [16,18].
Fig.8b: Sample #3b – XRD
The incidence of glauconite in Sample #3b may be from a number of sources. Glauconite is known to form and occur almost exclusively in marine environments. Glauconite is usually associated with the diagenetic alteration of sedimentary deposits, however it is also noted as formed by the replacement of K-feldspars (e.g. orthoclase) [19]. It could be that glauconite deposited allogenically over time at the edge of this specimen, or over time it has replaced K-feldspar original to the formation of this specimen. As I have written about in Ref. [1], host rock identification and geological surveys near the original Marovato deposits/mines is largely missing, but this specimen, like the first specimen, show possible scant evidence of host rock composition. An original host rock of high-silica content with the presence of K-feldspars is associated with intrusive felsic granites.
A tridymite-glauconite admixture is the first known observation in Ocean Jasper. Further discussion of this edge Sample #3b and the other edge Samples #1b & #1c is included in the analysis & discussion section below.
SPECIMEN #4
The fourth specimen is a classic large-spherulite variety from the Kabamby area, a surface collection area some 1.5 miles up the coast and inland from the old stock Marovato mines. One sample was tested from the back of this polished faced rough specimen, as shown in the specimen photos (Fig.9), by both EDS (Fig.10) and XRD (Fig.11).
Fig.9: Specimen #4 – Front
Fig.9: Specimen #4 – Back
Sample #4
The small sample from the circle marked contained both the yellow spherulite material and the green ringed spherulite material. EDS and XRD results indicate silica quartz (SiO2) with trace amounts of iron likely accounting for the colors. The XRD main and secondary peaks are relatively narrow, and secondary and tertiary peak intensities are of moderate height compared to the same <1011> and <1122> reflection peaks in an ideal alpha-quartz specimen [4]. Similar Kabamby material was characterized earlier by optical microscopy using crossed polarizers, which showed a crystal growth habit of fibrous chalcedony [10]. Future studies on this specimen will include high resolution optical and SEM imaging to further quantify and classify growth habits.
Fig.10: Sample #4 – EDS
Fig.11: Sample #4 – XRD
SPECIMEN #5
The fifth specimen is a small slab of rare old stock Ocean Jasper from off-shore, underground Marovato mines (estimated mining period 2003-2006), featuring large “bullseye” spherulites in a lacy chalcedony-quartz matrix, with horizontal agate-type banding along the bottom, numerous druzy pockets and quartz druzy growth on botryoidal chalcedony along the bottom edge. Two samples were tested from the areas marked in the specimen photo (Fig.12) by EDS only (Fig.13).
Fig.12: Specimen #5 - Front
Sample #5a
A small sample was taken from the banded gray-white area. The EDS spectrum (Fig.13a) indicates silica (SiO2).
Fig.13a: Sample #5a – EDS
Sample #5b
A small sample was taken from the reddish white spotted area. The EDS spectrum (Fig.13b) indicates silica (SiO2), for both the reddish area and the white spotted areas, with trace amounts of magnesium from the reddish area.
Fig.13b: Sample #5b – EDS
The plan is to conduct XRD tests on these samples, but the expectation is that the results will be similar to all others in this characterization study, indicating microcrystalline chalcedony.
SPECIMEN #6
The sixth specimen is a small polished faced rough chunk from off-shore, underground Marovato mines (estimated mining period 2003-2006), featuring “bullseye” spherulites in a semi-translucent matrix, with rare colors and intricate patterning. One sample was tested from the area marked in the specimen photos (Fig.14) by EDS only (Fig.15).
Fig.14: Specimen #6 – Front
Fig.14: Specimen #6 – Back
Sample #6
A small sample was taken from the rough back, of the tan matrix material only. The EDS spectrum (Fig.15) indicates silica (SiO2), with trace amounts of iron, calcium, potassium, aluminum and magnesium. An XRD will be conducted in the future, to indicate specifically which silica polymorph or quartz variety is present, but it is expected to be primarily chalcedony.
Fig.15: Sample #6 – EDS
SPECIMEN #7
The seventh specimen is a small rough nugget from an unknown collection site in Madagascar, but likely from the Marovato area mines. Large bullseye-type banded spherulites are present in a semi-translucent matrix, and one side has what appears to be either a weathered edge or part of another rock type. Two samples were tested from the areas marked in the specimen photos (Fig.16) by EDS only (Fig.17).
Fig.16: Specimen #7 – Side 1
Fig.16: Specimen #7 – Side 2
Sample #7a
A small sample was taken from the dark reddish semi-translucent area. The EDS spectrum (Fig.17a) indicates silica (SiO2) with a trace amount of iron likely accounting for the color. The chlorine and calcium weak peaks are probably from the detector.
Fig.17a: Sample #7a – EDS
Sample #7b
A small sample was taken from the off-white weathered area. The EDS spectrum (Fig.17b) indicates silica (SiO2) only.
Fig.17b: Sample #7b – EDS
Future XRD and imaging tests will be conducted to indicate the specific silica polymorph or quartz variety present, particularly for the weathered edge, which appears to have a granular and spongy texture.
ANALYSIS & DISCUSSION
The seven specimens for this characterization study were chosen from a range of mostly old stock material, mined 2006 and earlier. The first three specimens (#1-3) were carefully selected rare stock from off-shore, underground mines near Marovato area, with two of these specimens (#1 and #3) exhibiting “edge” characteristics that might indicate more information regarding host rock and the general environment that supported original formation. It should be expressed to the reader that such “edge” features are rather difficult to find in rare high-grade old-stock (HGOS) Marovato specimens.
As discussed at length in Ref. [1], HGOS Ocean Jasper is a heterogeneous to hyper-heterogenous spherulitic chalcedony with many complex transitions in spherulite and matrix types that can span a contiguous range of a cu-ft and above, with no breaks of other rock types seen, including that of a “host rock”. Agate features (translucency, banding, fortification), jasper features (mostly opaque regions) and crystalline druzy quartz growth are intertwined in these complex, contiguous wide-area arrangements. Ocean Jasper is like nothing seen anywhere else in the petrographic world. Therefore, the goal is to quantifiably characterize this rare rock to better understand original formation.
Aside from the deviant “edge” characterization results of Specimens #1 & #3 (discussed at length below), the bulk of the specimen characterization results indicate silica quartz (SiO2) with trace iron for color, and the primary variety of silica quartz is microcrystalline chalcedony. The variable XRD diffractograms over ideal alpha-quartz [4] may indicate either a mixture of chalcedony with macrocrystalline quartz and/or microcrystalline quartz of a granular variety, or it may indicate a chalcedony with a greater amount of crystalline order (less structural defects), different crystallite size, level of water, etc. that all contribute to the intensity differences and narrowing or broadening of chalcedony diffraction peaks [4,8]. None of the weak reflection peaks indicating the presence of intergrown moganite were observed in any of the XRDs. Further study must include high resolution optical, SEM and TEM imaging to gauge microcrystalline growth habit features for the widely different spherulite types and matrix transitions in a single specimen, namely for Specimen #2.
The “edge” specimen samples, Samples #1b, #1c and #3b, all exhibit divergent characteristics from the bulk of the specimen, namely the presence of some crystalline level of higher silica polymorphs cristobalite and tridymite. As mentioned previously, their respective XRDs (Figs.3b,3c,8b) may indicate the presence of Opal-C and Opal-CT/T, since the XRD features are qualitatively similar to XRDs for Opal-C and Opal-CT [5]. However, the alternative of disordered alpha-(low)-cristobalite and alpha-(low)-tridymite cannot be ruled out, and must be seriously considered, as the XRD features for each are often not distinguishable without additional treatments and tests. Both alpha-cristobalite and alpha-tridymite are known to occur metastably in a high-silica rock matrix with such broadened peak-shifted XRD characteristics, which appears in volcanogenic cristobalite [14,15], volcanogenic tridymite [15,20,21], and tridymite and cristobalite found in clast-rich melt rock [16]. The conditions attributed to these occurrences of alpha-cristobalite and alpha-tridymite are consistently from a high-silica precursor rapidly cooled from high temperatures, not from a low-temperature diagenetic sedimentary process that produces Opal-C and Opal-CT/T.
There are several key tests that can be conducted to distinguish between Opal-C and cristobalite, and Opal-CT and tridymite. The first of these is sample annealing [5]. Opal-C and Opal-CT have been shown to exhibit measurable <101> and <002> reflection peak shifting post annealing (1 hour at 1350°C), much more so for Opal-CT. The greater the amount of “structural disorder” and amorphous character present in the opal specimen (such as for Opal-CT/T), the greater the post-annealing shift. For Opal-C, post-annealing shift of the <101> peak is much less than that observed for the corresponding tridymite primary <002> peak of Opal-CT/T. Both Opal-C and Opal-CT post annealing transform to a disordered cristobalite with a structural state between well-ordered cristobalite and Opal-C [5]. Therefore, this test can be used as a qualitative indication of Opal-C and Opal-CT vs. disordered alpha-cristobalite and alpha-tridymite in Samples #1b, #1b and #3b, since if these samples contain the latter and not the former, the post-annealing peak shifts would likely be minimal.
The second test is sample solubility in reagents, such as phosphoric acid, potassium pyrosulfate, and sodium sulfide solutions [17]. Amorphous opaline silicas are substantially more soluble in such reagents than crystalline silica polymorphs, e.g. cristobalite and tridymite, which are essentially insoluble. The test involves boiling the sample in the reagent and measuring the weight of the undissolved solid; additional XRD tests on the undissolved solid can be done to quantify post treatment changes. Ref. [17] shows via XRD that all traces of Opal-CT are removed from some opaline samples following this treatment, whereas other samples with crystalline cristobalite present show much less change.
Infrared spectroscopy is also an indicator for distinguishing between Opal-C, Opal-CT/T and alpha-(low) cristobalite, tridymite. Fourier transform infrared spectroscopy (FTIR) on alpha-cristobalite samples clearly shows a much stronger absorption band over Opal-C and Opal-CT samples [5,13]. The Raman spectrum for natural orthorhombic alpha-tridymite is distinctly different from that of monoclinic alpha-tridymite and Opal-CT [16,18].
High resolution microscopy (optical and electron) can be done on these divergent samples to determine level of crystallized silica polymorphs cristobalite/tridymite over amorphous opaline silicas. These tests are much more time consuming and costly in sample prep and testing than the three simpler tests described above, but a complete characterization would involve all of these testing modalities.
The observation of glauconite in addition to tridymite in Sample #3b may indicate a replacement over time of K-feldspars with glauconite [19]. An original host rock of high-silica content with the presence of K-feldspars is associated with intrusive felsic granites.
Finally, the goal of these characterizations is to better quantify and understand original formation of HGOS Ocean Jasper, both from the Marovato marine region and the inland Kabamby region, but particularly the rare large-scale deposits of hyper-heterogeneous spherulitic chalcedony from the off-shore, underground Marovato mines.
There are three distinct “host” environments that may account for the formation of this material:
(1) Extrusive volcanic processes, particularly devitrification of an obsidian lava flow that forms devitrification spherulites, followed by a weathering process that involves repeated changes in groundwater chemistry, dilution from an alkali-silica reaction, recrystallization, of silica polymer colloids into jasper, chalcedony and quartz, originating from obsidian [22];
(2) Intrusive volcanic processes, particularly a high-silica solution in a large host-rock chamber of felsic granite that undergoes rapid cooling followed by supersaturation of the attendant solution, nucleation and growth of spherulites, and hardening/crystallization of the silica polymer colloids into chalcedony, quartz, silica polymorphs (e.g. cristobalite and tridymite), and jasper, originating from the high silica solution [1];
(3) Diagenetic sedimentary processes, particularly those described in [23] involving the relatively low-temperature formation of Opal-CT and quartz from amorphous Opal-A, originating inorganically from amorphous opaline deposits and silcretes or organically from diatoms, radiolarians, silicoflagellates, sponges, and some terrestrial plants (biogenic silica).
I have discussed at length in Ref. [1] the favorable arguments supporting formation environment (2) over that of (1), on various grounds that I will not include in this characterization paper. A few of those arguments may be used to diminish or rule out (3), namely the character of deposits of large-scale contiguous, well-crystallized specimen structures of hyper-heterogenous spherulitic/matrix complexity found near Marovato. Such low-temperature processes of (3) that are replete elsewhere have never produced these kinds of structures elsewhere.
“These speculations await direct empirical validation.”
NEXT-STEP CHARACTERIZATION TESTS
The following is a comprehensive list of “next-step” characterization tests on each of the specimen samples and the expected benefit. Once these are completed, a second part characterization paper will be published.
Qualitative SEM/EDS and powder XRD tests were conducted first, as they represent quick and relatively inexpensive test modes to determine compositional and crystallographic information for each specimen sample. Samples were carefully chosen from each specimen to convey the most generalizable information about the specimen as a whole.
This characterization study was completed using specimens from the author’s collection, and funds donated by the author for all test costs.
The “next-step” tests outlined below represent a much costlier set of tests, particularly high-resolution imaging in all modalities. Sample preparation is also much more challenging, requiring thin sections that are optically flat. Though I have identified at least one possible testing facility for each test below, I am also looking for any additional recommendations for test facilities, particularly ones that might be less expensive than those I have already sourced. Recommendations from Readers are appreciated greatly; please contact me below (*).
High Resolution Microscopy/Imaging
Optical (mm, sub-mm scales; crossed polarization included)
SEM (µm and sub-µm scales)
TEM (nm scale)
Benefits: Resolution of crystal groups and growth habits at each successive scale, for spherulites and the surrounding matrix, plus the divergent “edge” samples
Infrared Spectroscopy
FTIR
Raman
Benefits: Partially definitive distinction between Opal-C, Opal-CT/T and alpha-cristobalite and alpha-tridymite; ability to measure short-range order and characterize both disordered crystalline and amorphous materials with short-range order
Annealing & Reagent Solubility Tests, followed by Powder XRD
Benefits: Partially definitive distinction between Opal-C, Opal-CT/T and alpha-cristobalite and alpha-tridymite; complementary to infrared spectroscopy
–––––––
*Contact information: contact[at]oceanjasper.org
Funding for this study provided by: Susanne Lomatch
Website: OceanJasper.org
REFERENCES:
[1] “Ocean Jasper: A Natural Wonder and a Geological Mystery,” Susanne Lomatch, Oct. 31, 2019, KDP Publishing [https://www.amazon.com/Ocean-Jasper-Natural-Geological-Mystery/dp/1703393511/ref=tmm_pap_swatch_0?_encoding=UTF8&qid=&sr=]
[2] EDS/SEM results on samples sent to Kerry Day of Kaygeedee Minerals, Ottawa, Canada
[3] Powder XRD results on samples sent to John Attard of Attard’s Minerals, San Diego, CA
[4] “Structural Defects in Microcrystalline Silica,” H.A. Graetsch, O.W. Flörke, and G. Miehe,
Physics and Chemistry of Minerals, v.14(3), p.249-257, 1987
[5] “Nomenclature of micro- and non-crystalline silica minerals, based on structure and microstructure,” O.W. Flörke, et al., Neues Jahrbuch für Mineralogie – Abhandlungen, v.163, p.19-42, 1991
[6] “Structural characteristics of opaline and microcrystalline silica minerals,” H.A. Graetsch, Reviews in Mineralogy and Geochemistry, Silica, v.29, p.209-232, 1994
[7] “A proposed mechanism for the growth of chalcedony,” P.J. Heaney, Contributions to Mineralogy and Petrology, v.115, p.66-74, 1993
[8] “Structural disparities between chalcedony and macrocrystalline quartz,” P.J. Heaney, D.R. Veblen, and J.E. Post, American Mineralogist, v.79, p.452-460, 1994
[9] “Electrical and optical properties of chalcedony and striped chalcedony, A. Çetin, et al., Vacuum, v.97, p.75-80, 2013
[10] Matthews, C., “The Geology, Varieties and History of Ocean Jasper, Part I,” Enter the Earth Blog, January 2015. [http://www.entertheearth.com/the-geology-varieties-and-history-of-ocean-jasper-part-one]
[11] Strekeisen, A. See website http://www.alexstrekeisen.it/english/meta/oceanjasper.php for numerous polarized light microphotographs of Ocean Jasper samples showing spherulites and fibrous chalcedony with irregular polygon boundaries.
[12] “NMR, XRD and IR study on microcrystalline opals,” H. Graetsch, H. Gies, and I. Topalovic, Physics and Chemistry of Minerals, v.21, p.166-175, 1994
[13] “The structure of opal-CT revisited,” M.J. Wilson, Journal of Non-Crystalline Solids, v.405, p.68-75, 2014. This review has many references to a large body of earlier characterization work on Opal-C and Opal-CT.
[14] “The a–b phase transition in volcanic cristobalite,” D.E. Damby, et al., Journal of Applied Crystallography, v.47, p.1205-1215, 2014
[15] “The structure and texture of Opal-CT and Opal-C in volcanic rocks,” T. Nagase & M. Akizuki, The Canadian Mineralogist, v.35, p.947-958, 1997
[16] “Monoclinic tridymite in clast-rich impact melt rock from the Chesapeake Bay impact,” J.C. Jackson, et al., American Mineralogist, v.96, p.81-88, 2011
[17] “Distinguishing opaline silica from cristobalite in bentonites: a practical procedure and perspective based on NaOH dissolution,” S. Hiller & D.G. Lumsdon, Clay Minerals, v.43, p.477-486, 2008
[18] “Structural state of microcrystalline opals: A Raman spectroscopic study,” A. Ilieva, et al., American Mineralogist, v.92, p.1325-1333, 2007
[19] “Origin and geochemical characterization of the glauconites in the Upper Cretaceous Lameta Formation, Narmada Basin, central India,” U. Bansal, et al., Journal of Palaeogeography, v.7(2), p.99-116, 2018
[20] “The first finding of monoclinic tridymite in terrestrial volcanic rocks,” K. Kawai, et al., Mineralogical Journal, v.9(4), p.231-235, 1978
[21] “The significance of tridymite in igneous and metamorphic petrogenesis,” G.P. Black, Mineral Mag v.30(227), p.518–524, 1954
[22] “Banded Agates: A Genetic Approach,” M. Campos-Venuti, Edizioni AccorpaMente, 2018
[23] “Silica diagenesis II: General mechanisms,” L.A. Williams & D.A. Crerar, Journal of Sedimentary Petrology, v.55(3), p.312-321, 1985
Article has been viewed at least 5570 times.


