 | Trubač, Jakub, Ackerman, Lukáš, Gauert, Christoph, Ďurišová, Jana, Hrstka, Tomáš (2018) Platinum-Group Elements and Gold in Base Metal Sulfides, Platinum-Group Minerals, and Re-Os Isotope Compositions of the Uitkomst Complex, South Africa. Economic Geology, 113 (2) 439-461 doi:10.5382/econgeo.2018.4557 | Journal (article/letter/editorial) | | and Re-Os Isotope Compositions of the Uitkomst Complex, South Africa Jakub Trubač,1,2,† Lukáš Ackerman...University of the Free State, Bloemfontein 9300, South Africa of Applied Geology and Geohazards, Geological...Lakefield, Ontario KOL 2HO, Canada Abstract The Uitkomst Complex is a Ni-Cu-PGE-Cr-Co mineralized composite...composite mafic-ultramafic intrusion situated in South Africa. The platinum-group elements (PGEs), Re and Au...the various mineralized zones of the complex. BMS within the complex have elevated PGE and Au contents, |  | | Book | | born hills appear parallel to Mahagiri range due to mine-waste dumping. Unpaved roads serve the movement...The sky is gloomy throughout the day due to the mine and road dust. Social evils, crime, alcoholism,...special talents, I am only passionately curious - Albert Einstein. When I was a postgraduate student...education, counseling, and training. Making stringent mine-safety rules is not the solution—it has to be implemented...Bushveld chromite–platinum group metals (PGMs), South Africa, Sudbury nickel–copper, Canada, and a few new |  | | Journal (article/letter/editorial) | | a Case Study from the Merensky Reef, Bushveld Complex Downloaded from http://petrology.oxfordjournals...the Merensky Reef at Bafokeng Rasimone Platinum Mine (BRPM) are described. A model for the formation...at BRPM and at other locations in the Bushveld Complex. To achieve this it is necessary to understand...Emplacement of these magmas into the Bushveld Complex resulted in thermo-mechanical erosion of the floor...magma emplacement owing to interaction with the local Transvaal sediments. As a result, mechanical separation | 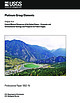 | | Report (issue) | | gov/images/periodictable.pdf. Cover. Stillwater Mine in south-central Montana, looking southeast. The pond...in the lower left include the shaft, the mill complex, and offices. Photograph by Michael L. Zientek...Methods......................................N39 Mine Waste Characteristics.........................................................................N42 Mine Closure...........................................sulfide ore exposed in a stope in the Oktyabr’sk Mine in the Talnakh area, Russia.................... |  | | Conference Proceedings (Volume) | | Cover photograph: View of the Aitik open pit copper mine in the very north of Sweden. Mining operations started...the Grano fault in the Bathtub intrusion (Duluth Complex, Minnesota, USA) .. .............................footwall of the Spruce Road deposit, South Kawishiwi intrusion, Duluth Complex, Minnesota, USA . . ............the Black Thor–Black Label ultramafic intrusive complex, McFaulds Lake greenstone belt, Ontario .........Shinkle Ni-Cu-PGE mineralisation of the Riwaka Complex, Northwest Nelson, New Zealand . . .......... |  | | Conference Proceedings (Volume) | | Cover photograph: View of the Aitik open pit copper mine in the very north of Sweden. Mining operations started...regional scale 3D-model of the Skellefte mining district, northern Sweden ..............................VHMS-type deposits, Kristineberg area, Skellefte District, Sweden . . ....................................modelling for VMS exploration in the Pyhäsalmi district, Central Finland ..............................body structural complexities: KDC East Gold Mine, South Africa . . ................................... | 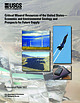 | | Report (issue) | | niobium in Brazil; and platinum-group elements in South Africa and Russia), thus increasing the risk for supply....B3 Graph showing dates associated with all the mine sites on the U.S. Environmental Protection Agency’s...production, U.S. apparent consumption, and U.S. mine production of antimony from 1900 to 2012............................F2 Graph showing world cobalt mine and refinery production and apparent consumption.....................F2 Graph showing world cobalt mine production from 1950 to 2011................... |
|


